Navigate the dbt Insights interface EnterpriseEnterprise +
Learn how to navigate Insights interface and use the main components.
Insights provides an interactive interface for writing, running, and analyzing SQL queries. This section highlights the main components of Insights.
Query console
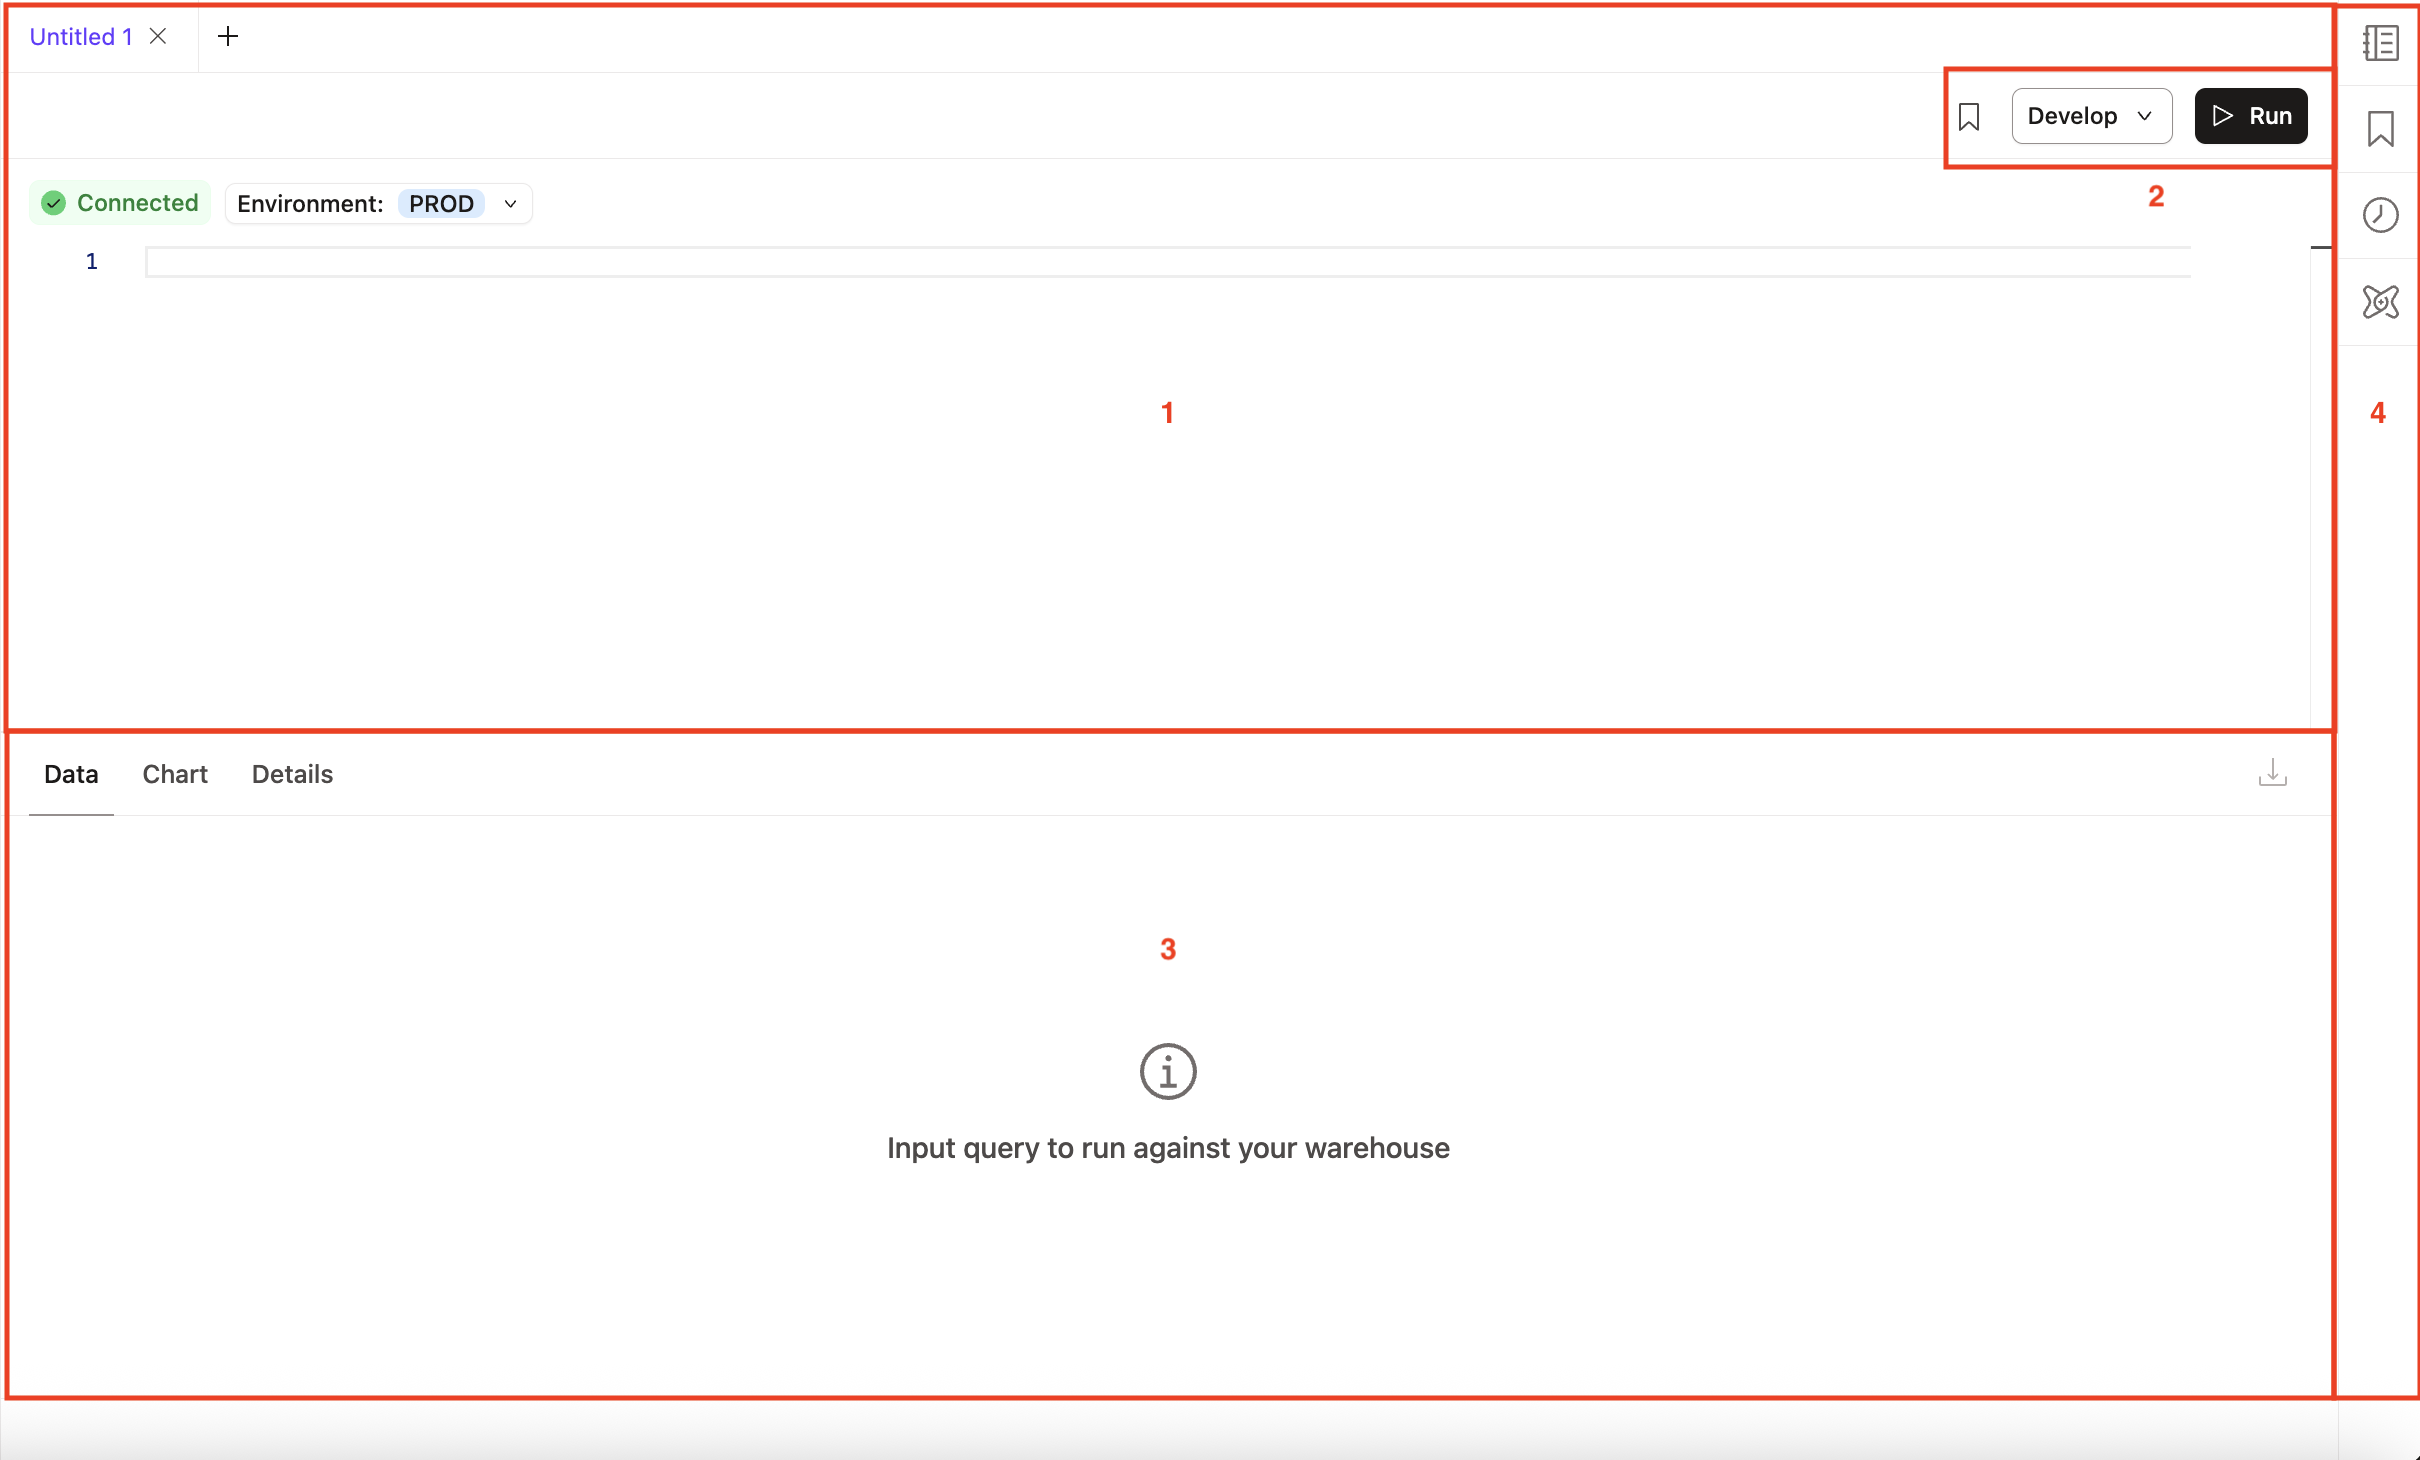
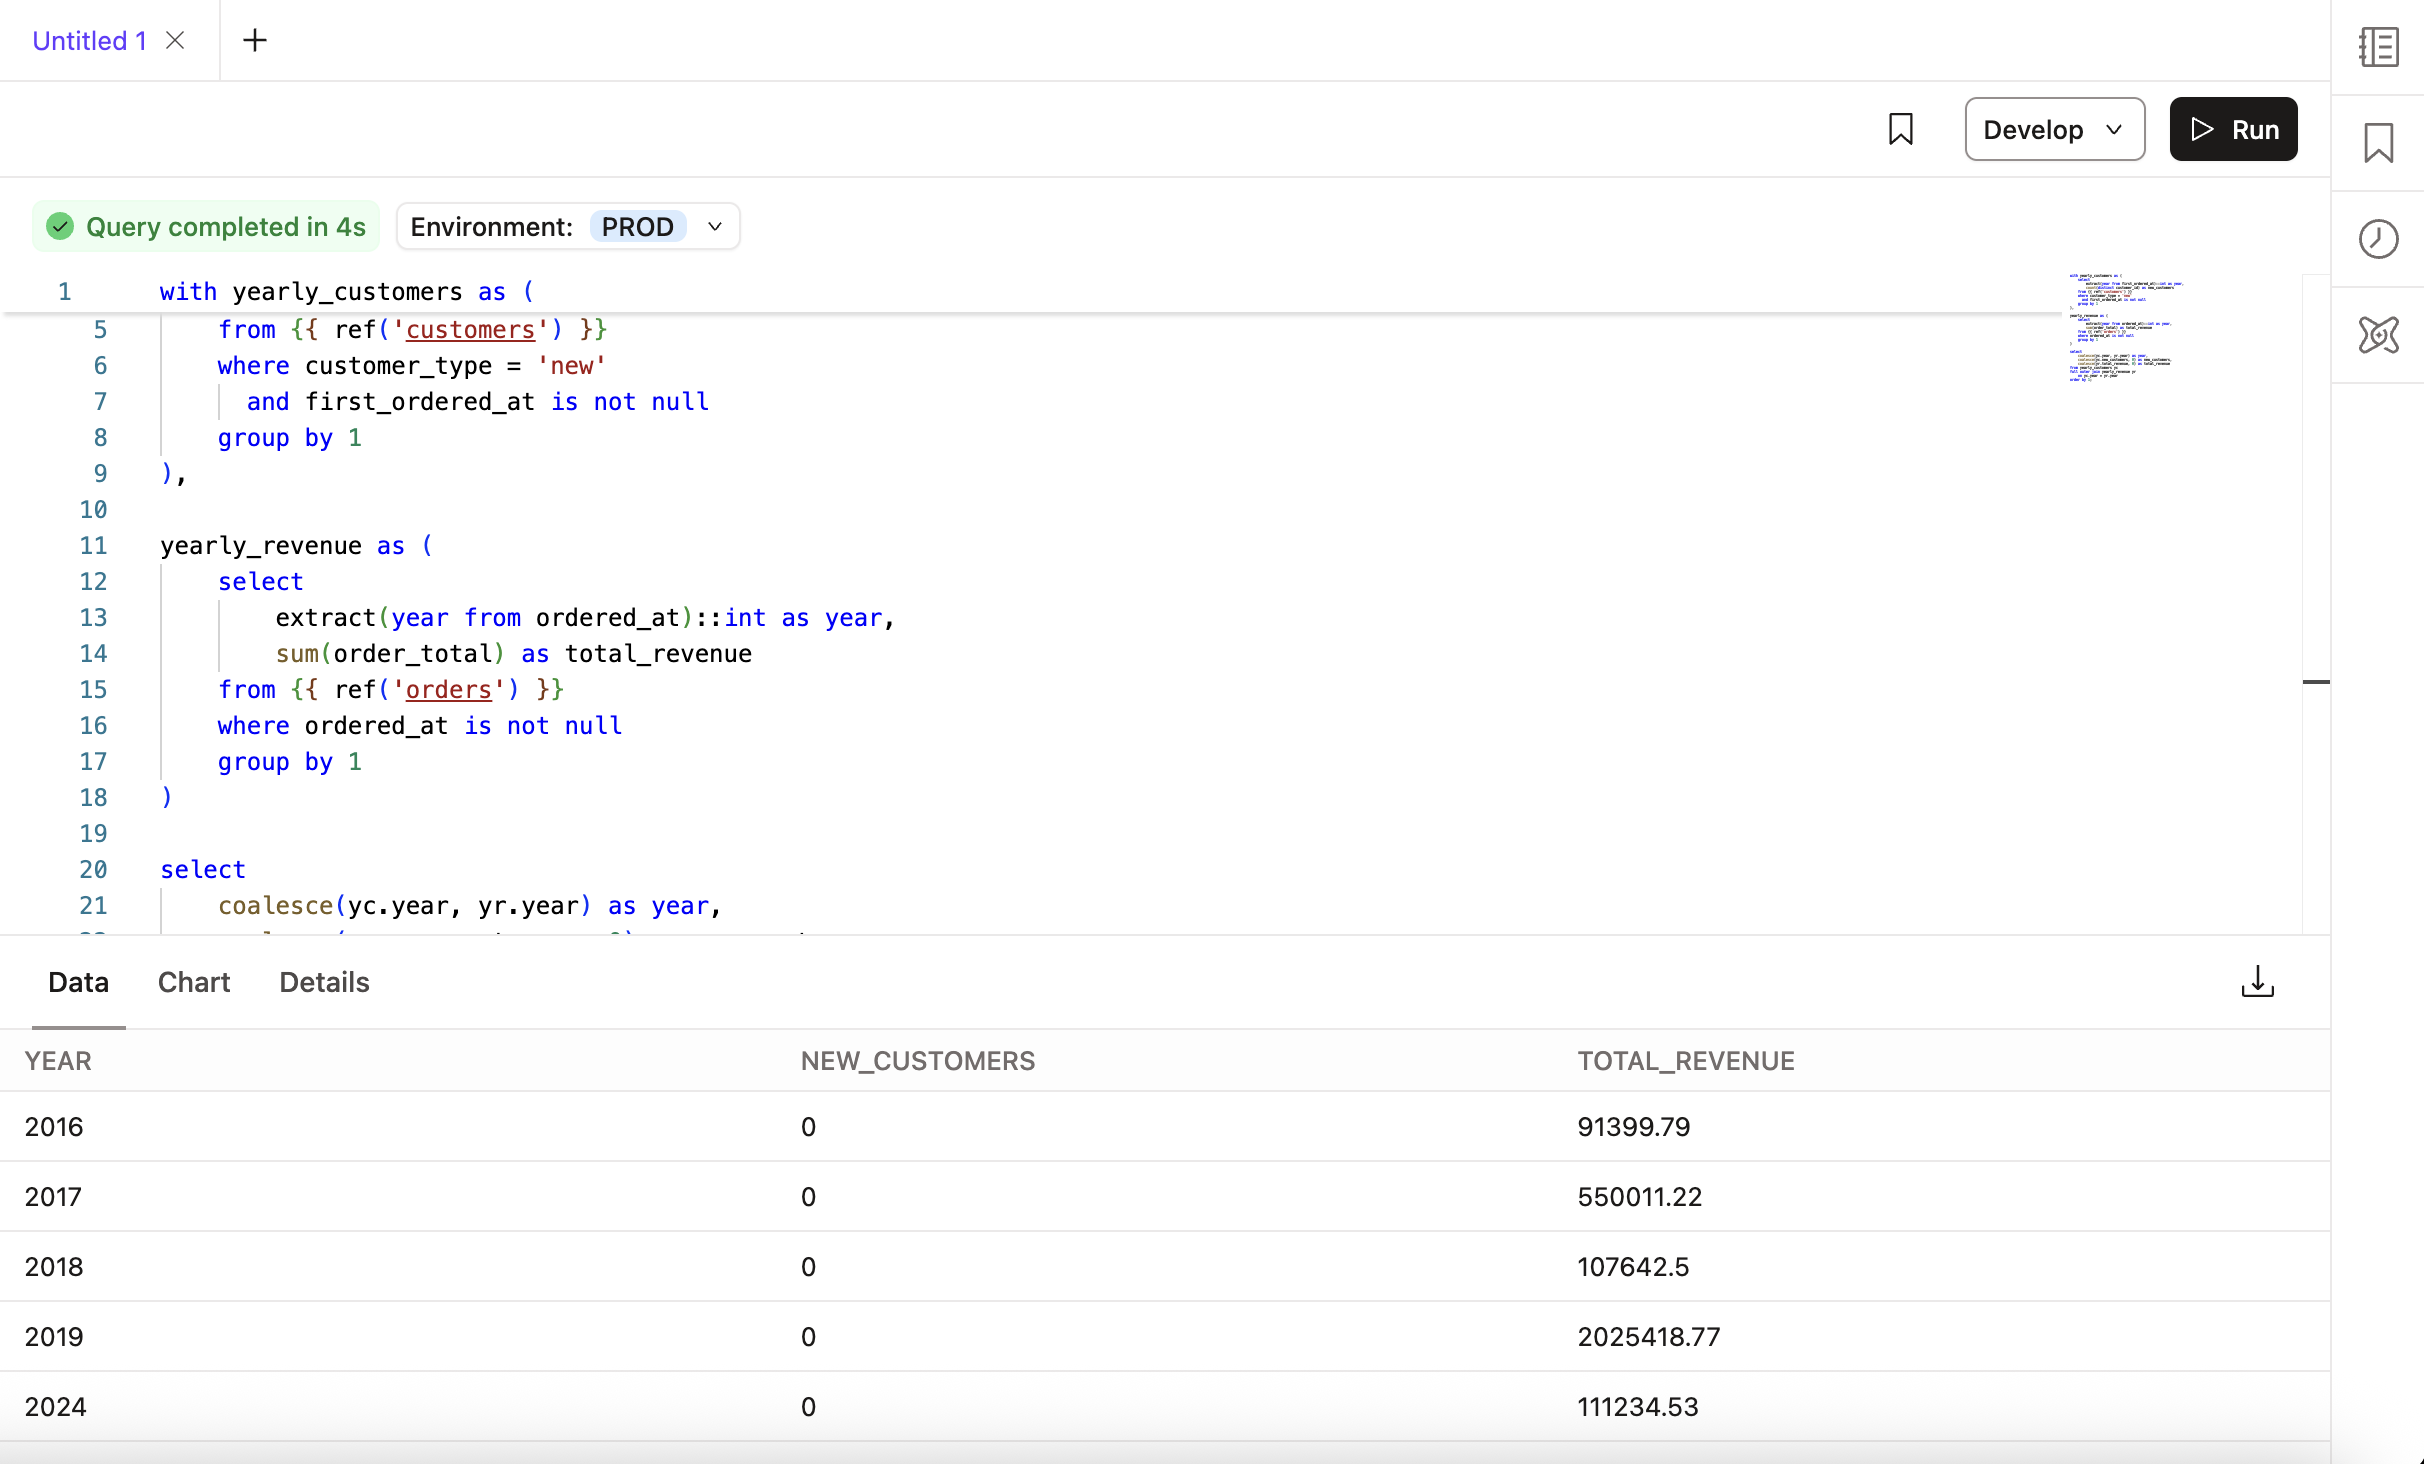
The query console is the main component of Insights. It allows you to write, run, and analyze SQL queries. The Query console supports:
- Query console editor, which allows you to write, run, and analyze SQL queries:
- It supports syntax highlighting and autocomplete suggestions
- Hyperlink from SQL code
refto the corresponding Explorer page
- Query console menu, which contains Bookmark (icon), Develop, and Run buttons.
- Query output panel, below the query editor and displays the results of a query:
- Has three tabs: Data, Chart, and Details, which allow you to analyze query execution and visualize results.
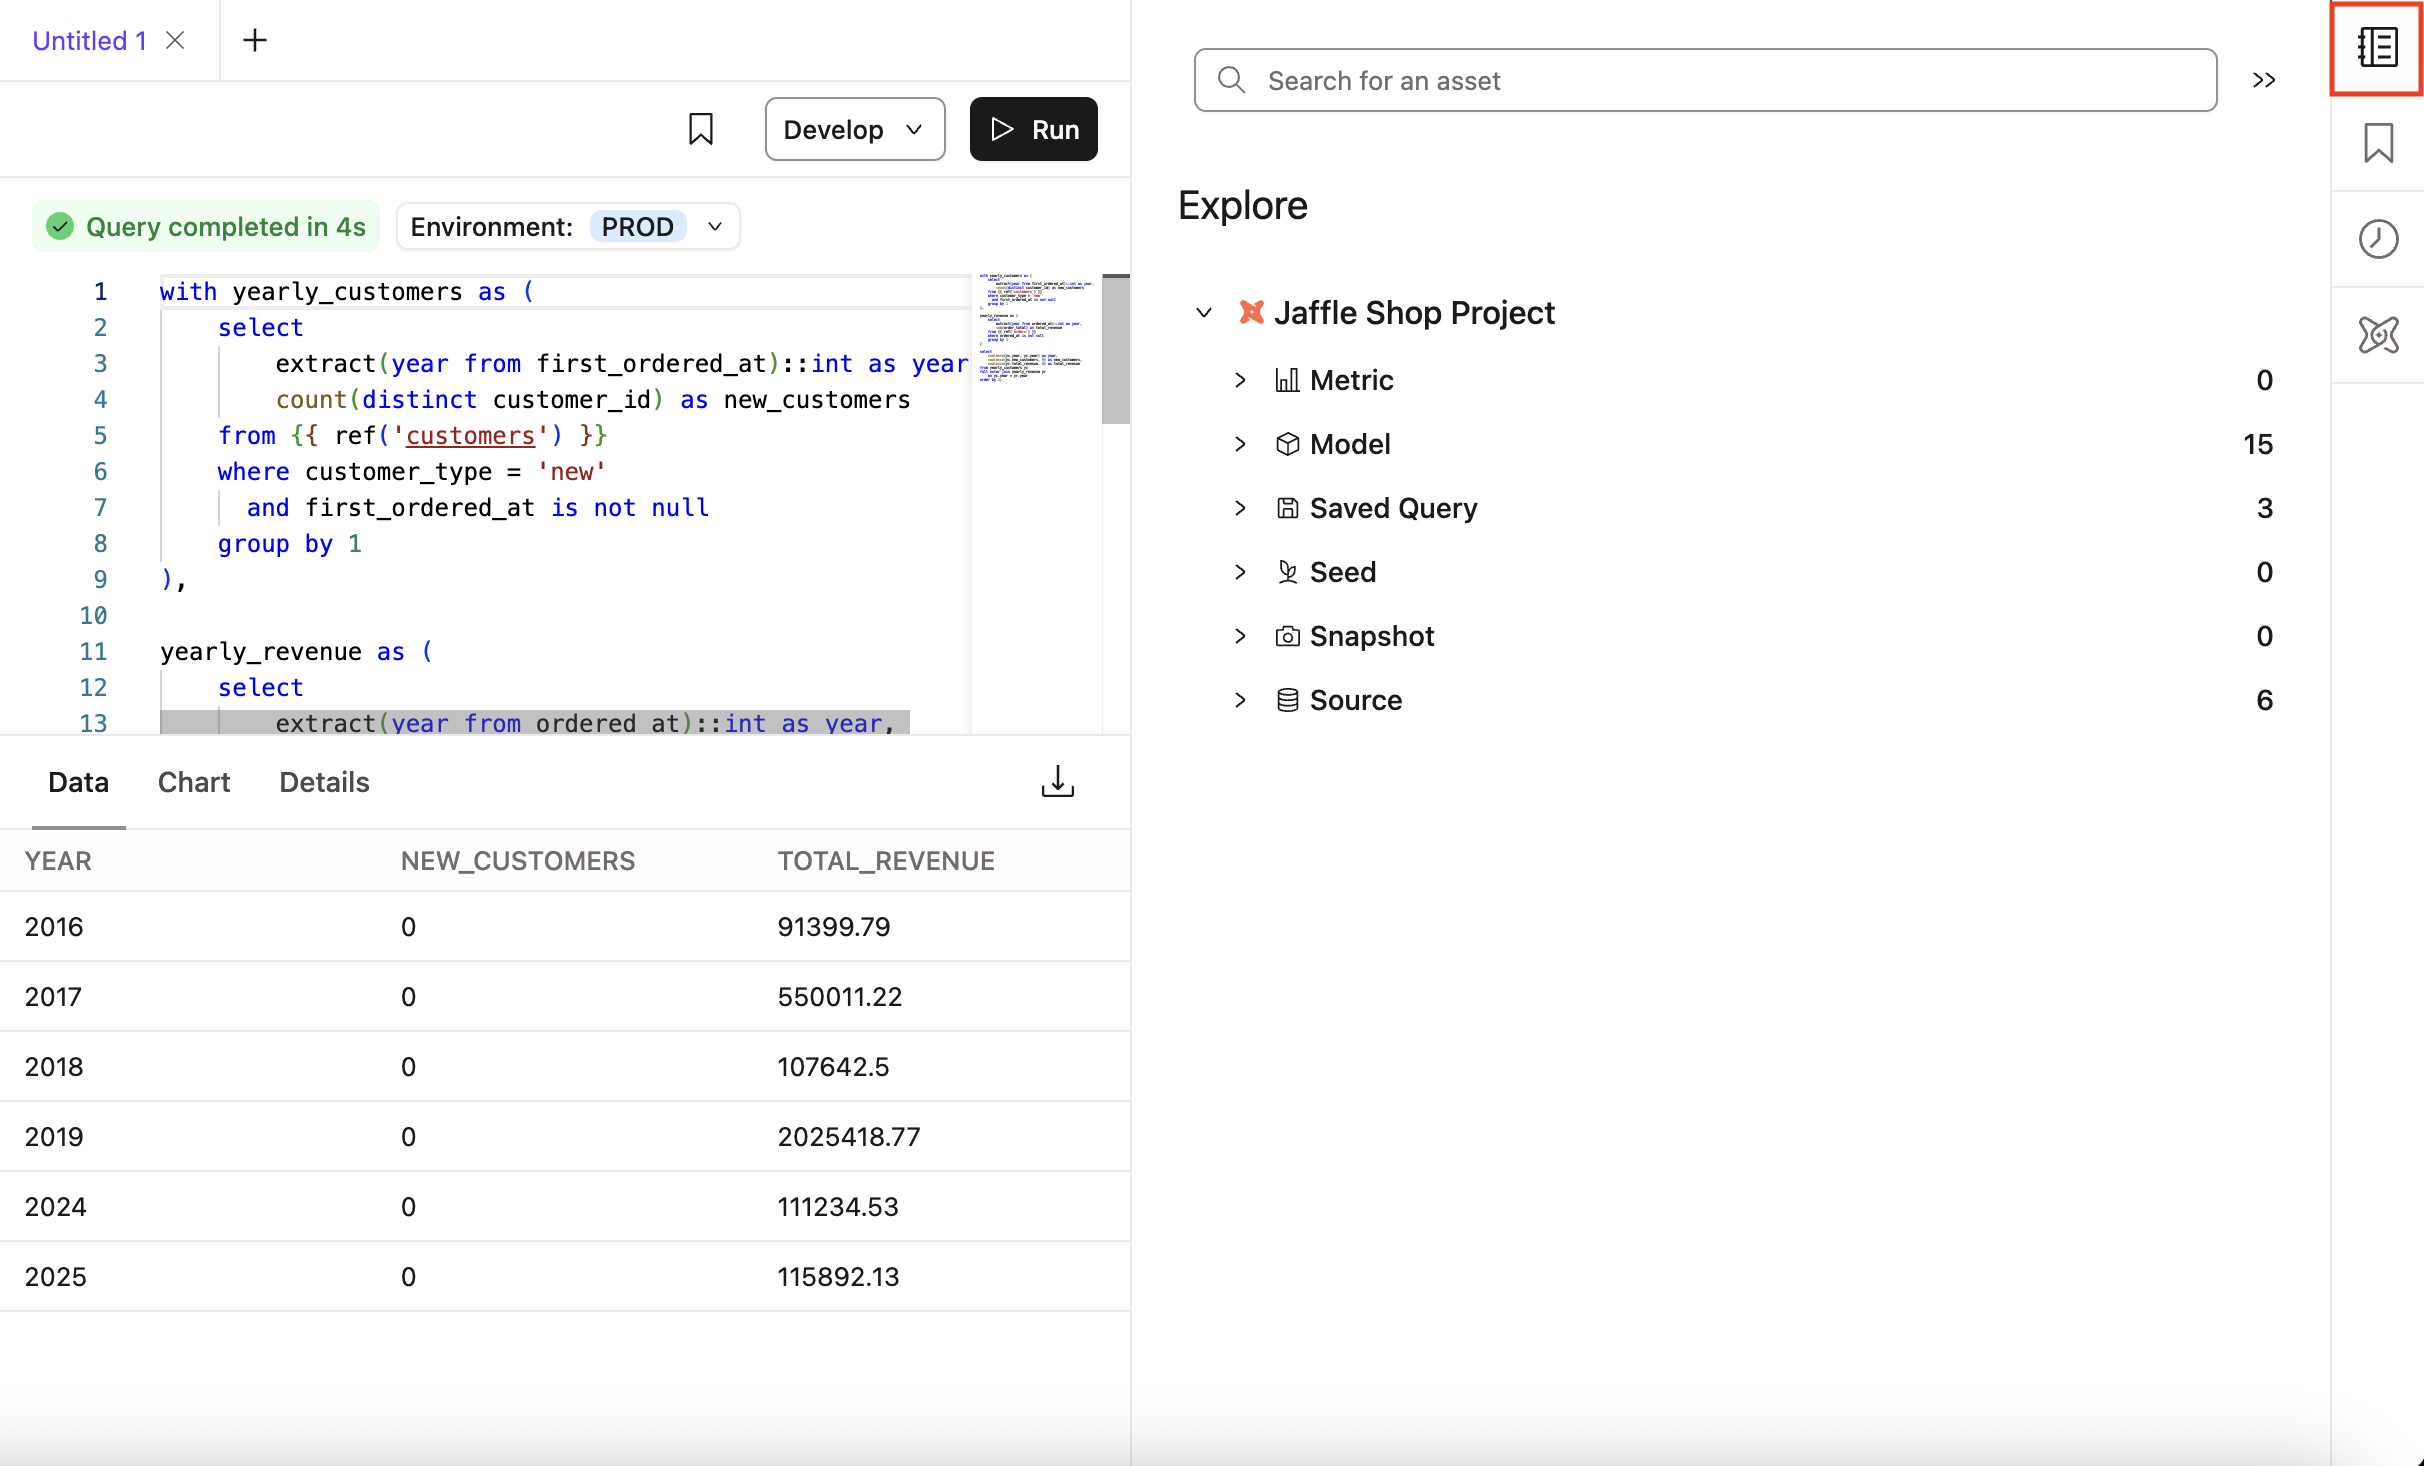
- Query console sidebar menu, which contains the Catalog, Bookmark, Query history, and Copilot icons.
Query console menu
The Query console menu is located at the top right of the Query editor. It contains the Bookmark, Develop, and Run buttons:
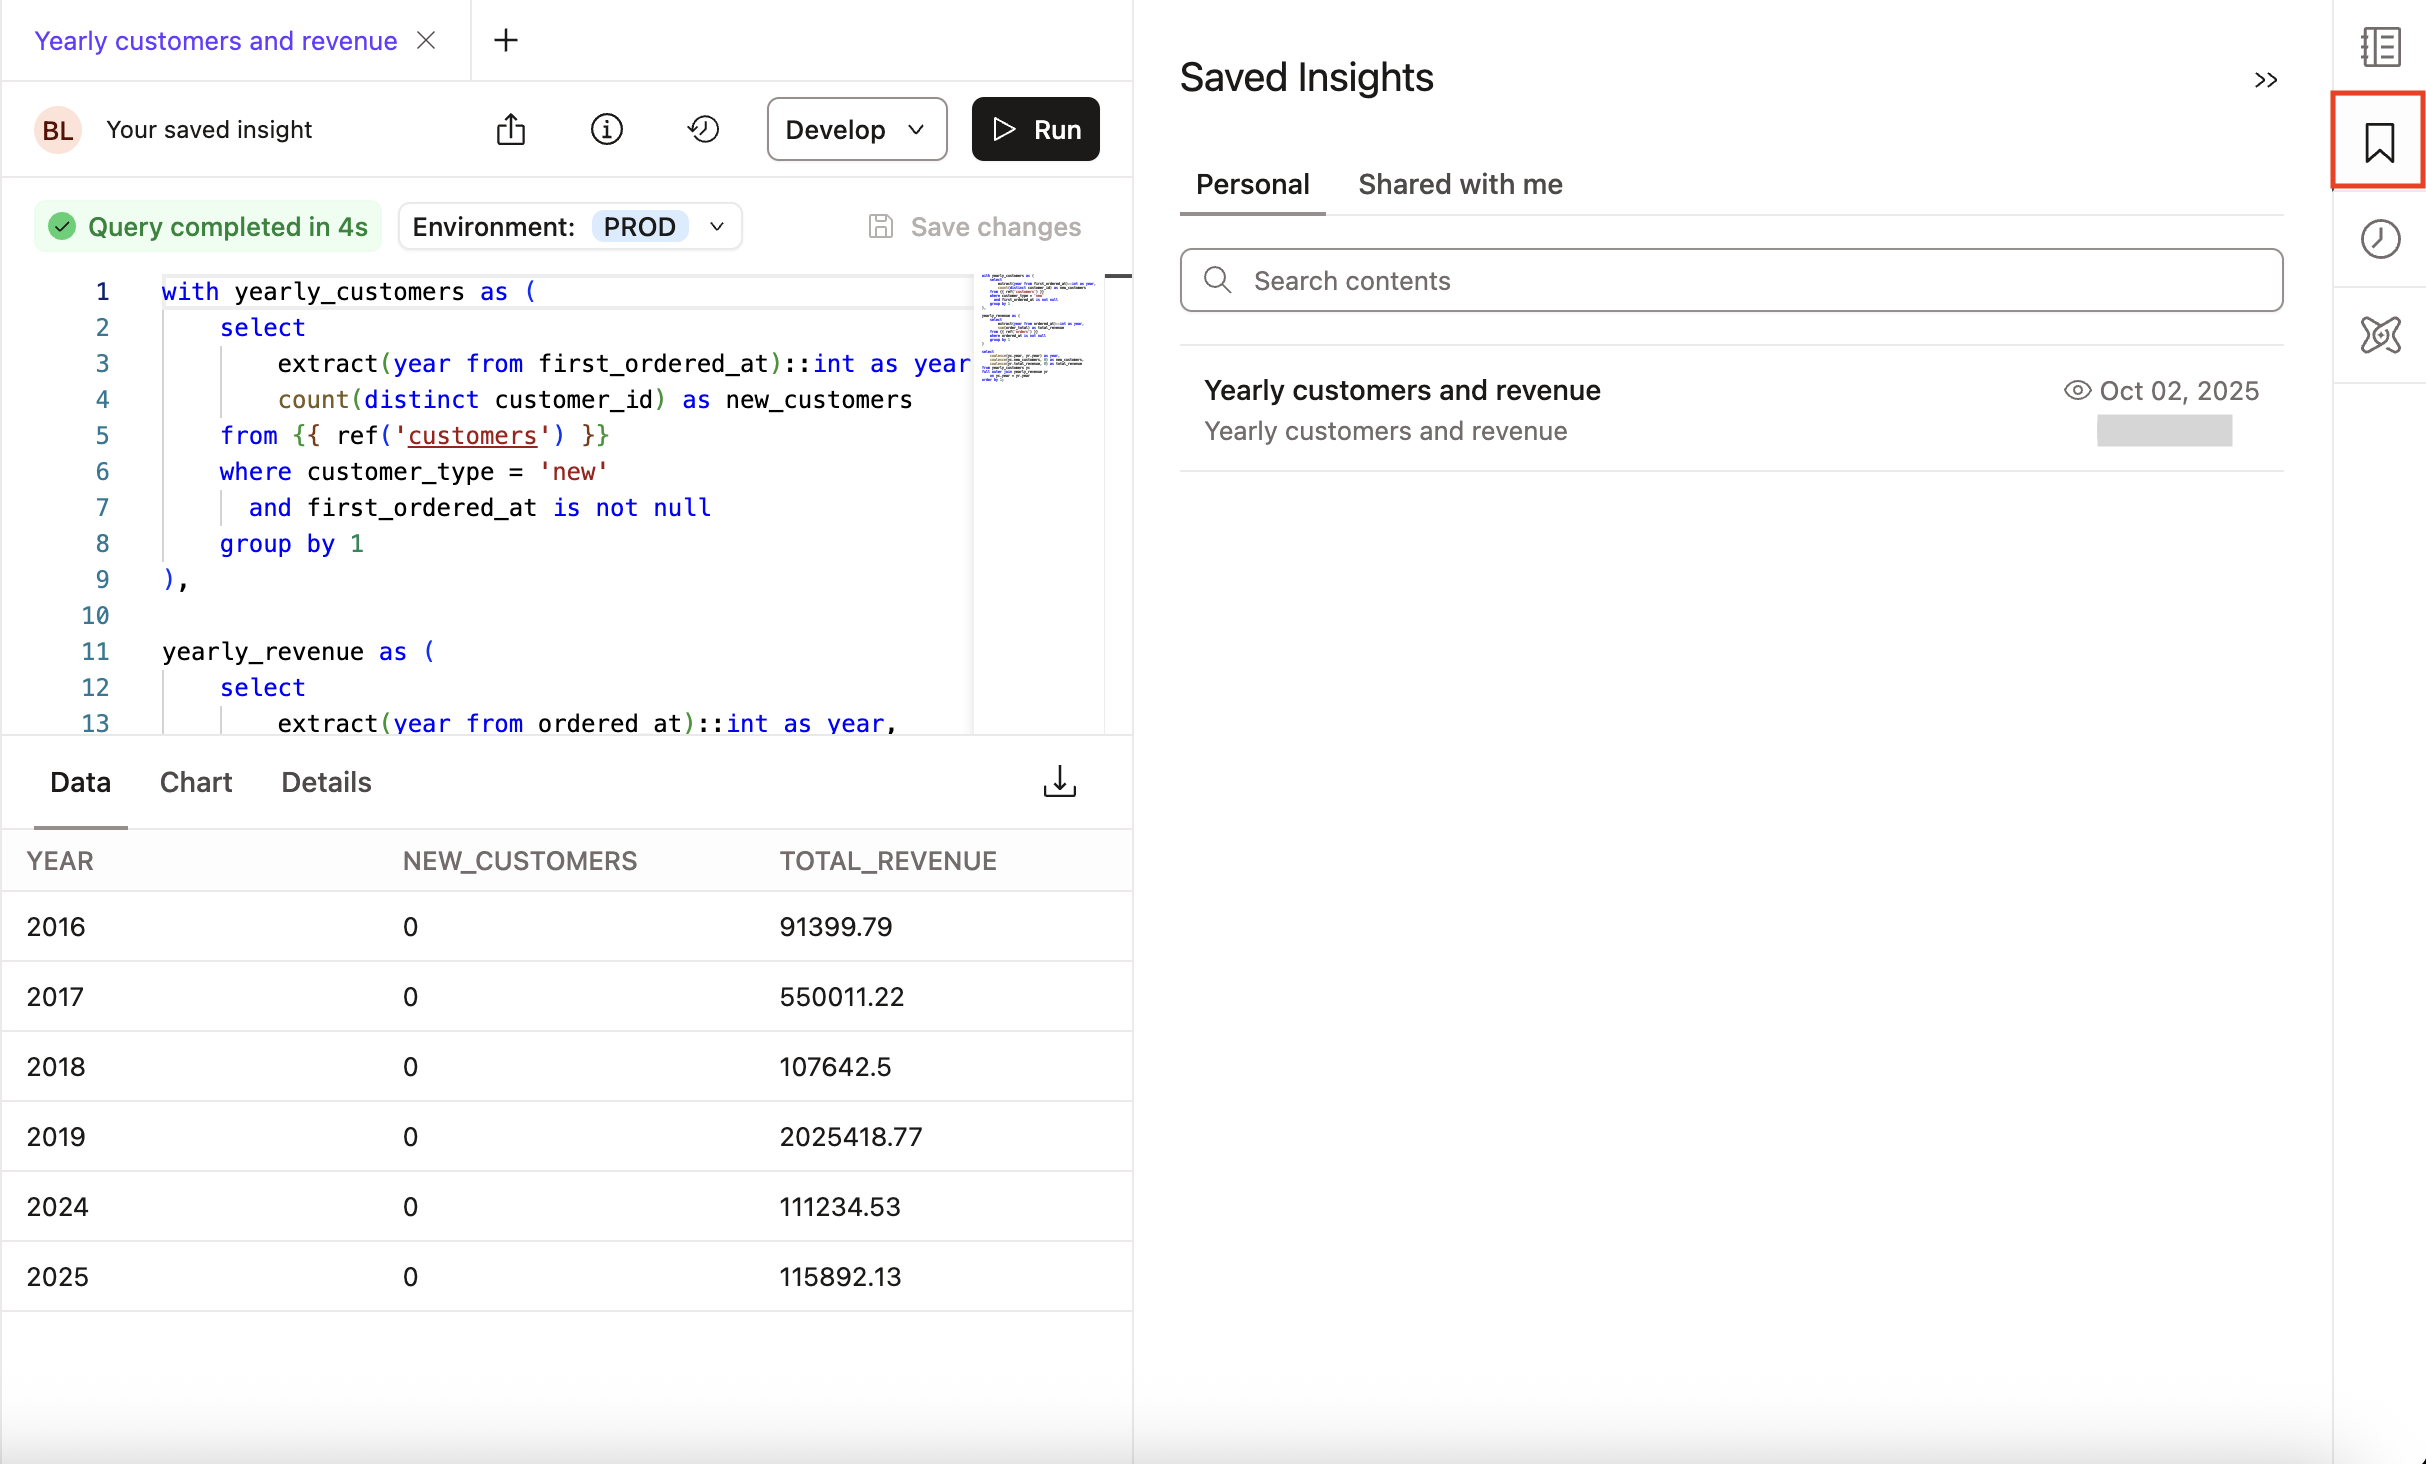
- Bookmark button — Save your frequently used SQL queries as favorites for easier access.
- When you click Bookmark, a Bookmark Query Details modal (pop up box) will appear where you can add a Title and Description.
- Let Copilot do the writing for you — use the AI assistant to automatically generate a helpful description for your bookmark.
- Access the newly created bookmark from the Bookmark icon in the Query console sidebar menu.
- Develop: Open the Studio IDE or Canvas to continue editing your SQL query.
- Run button — Run your SQL query and view the results in the Data tab.
Query Builder Beta
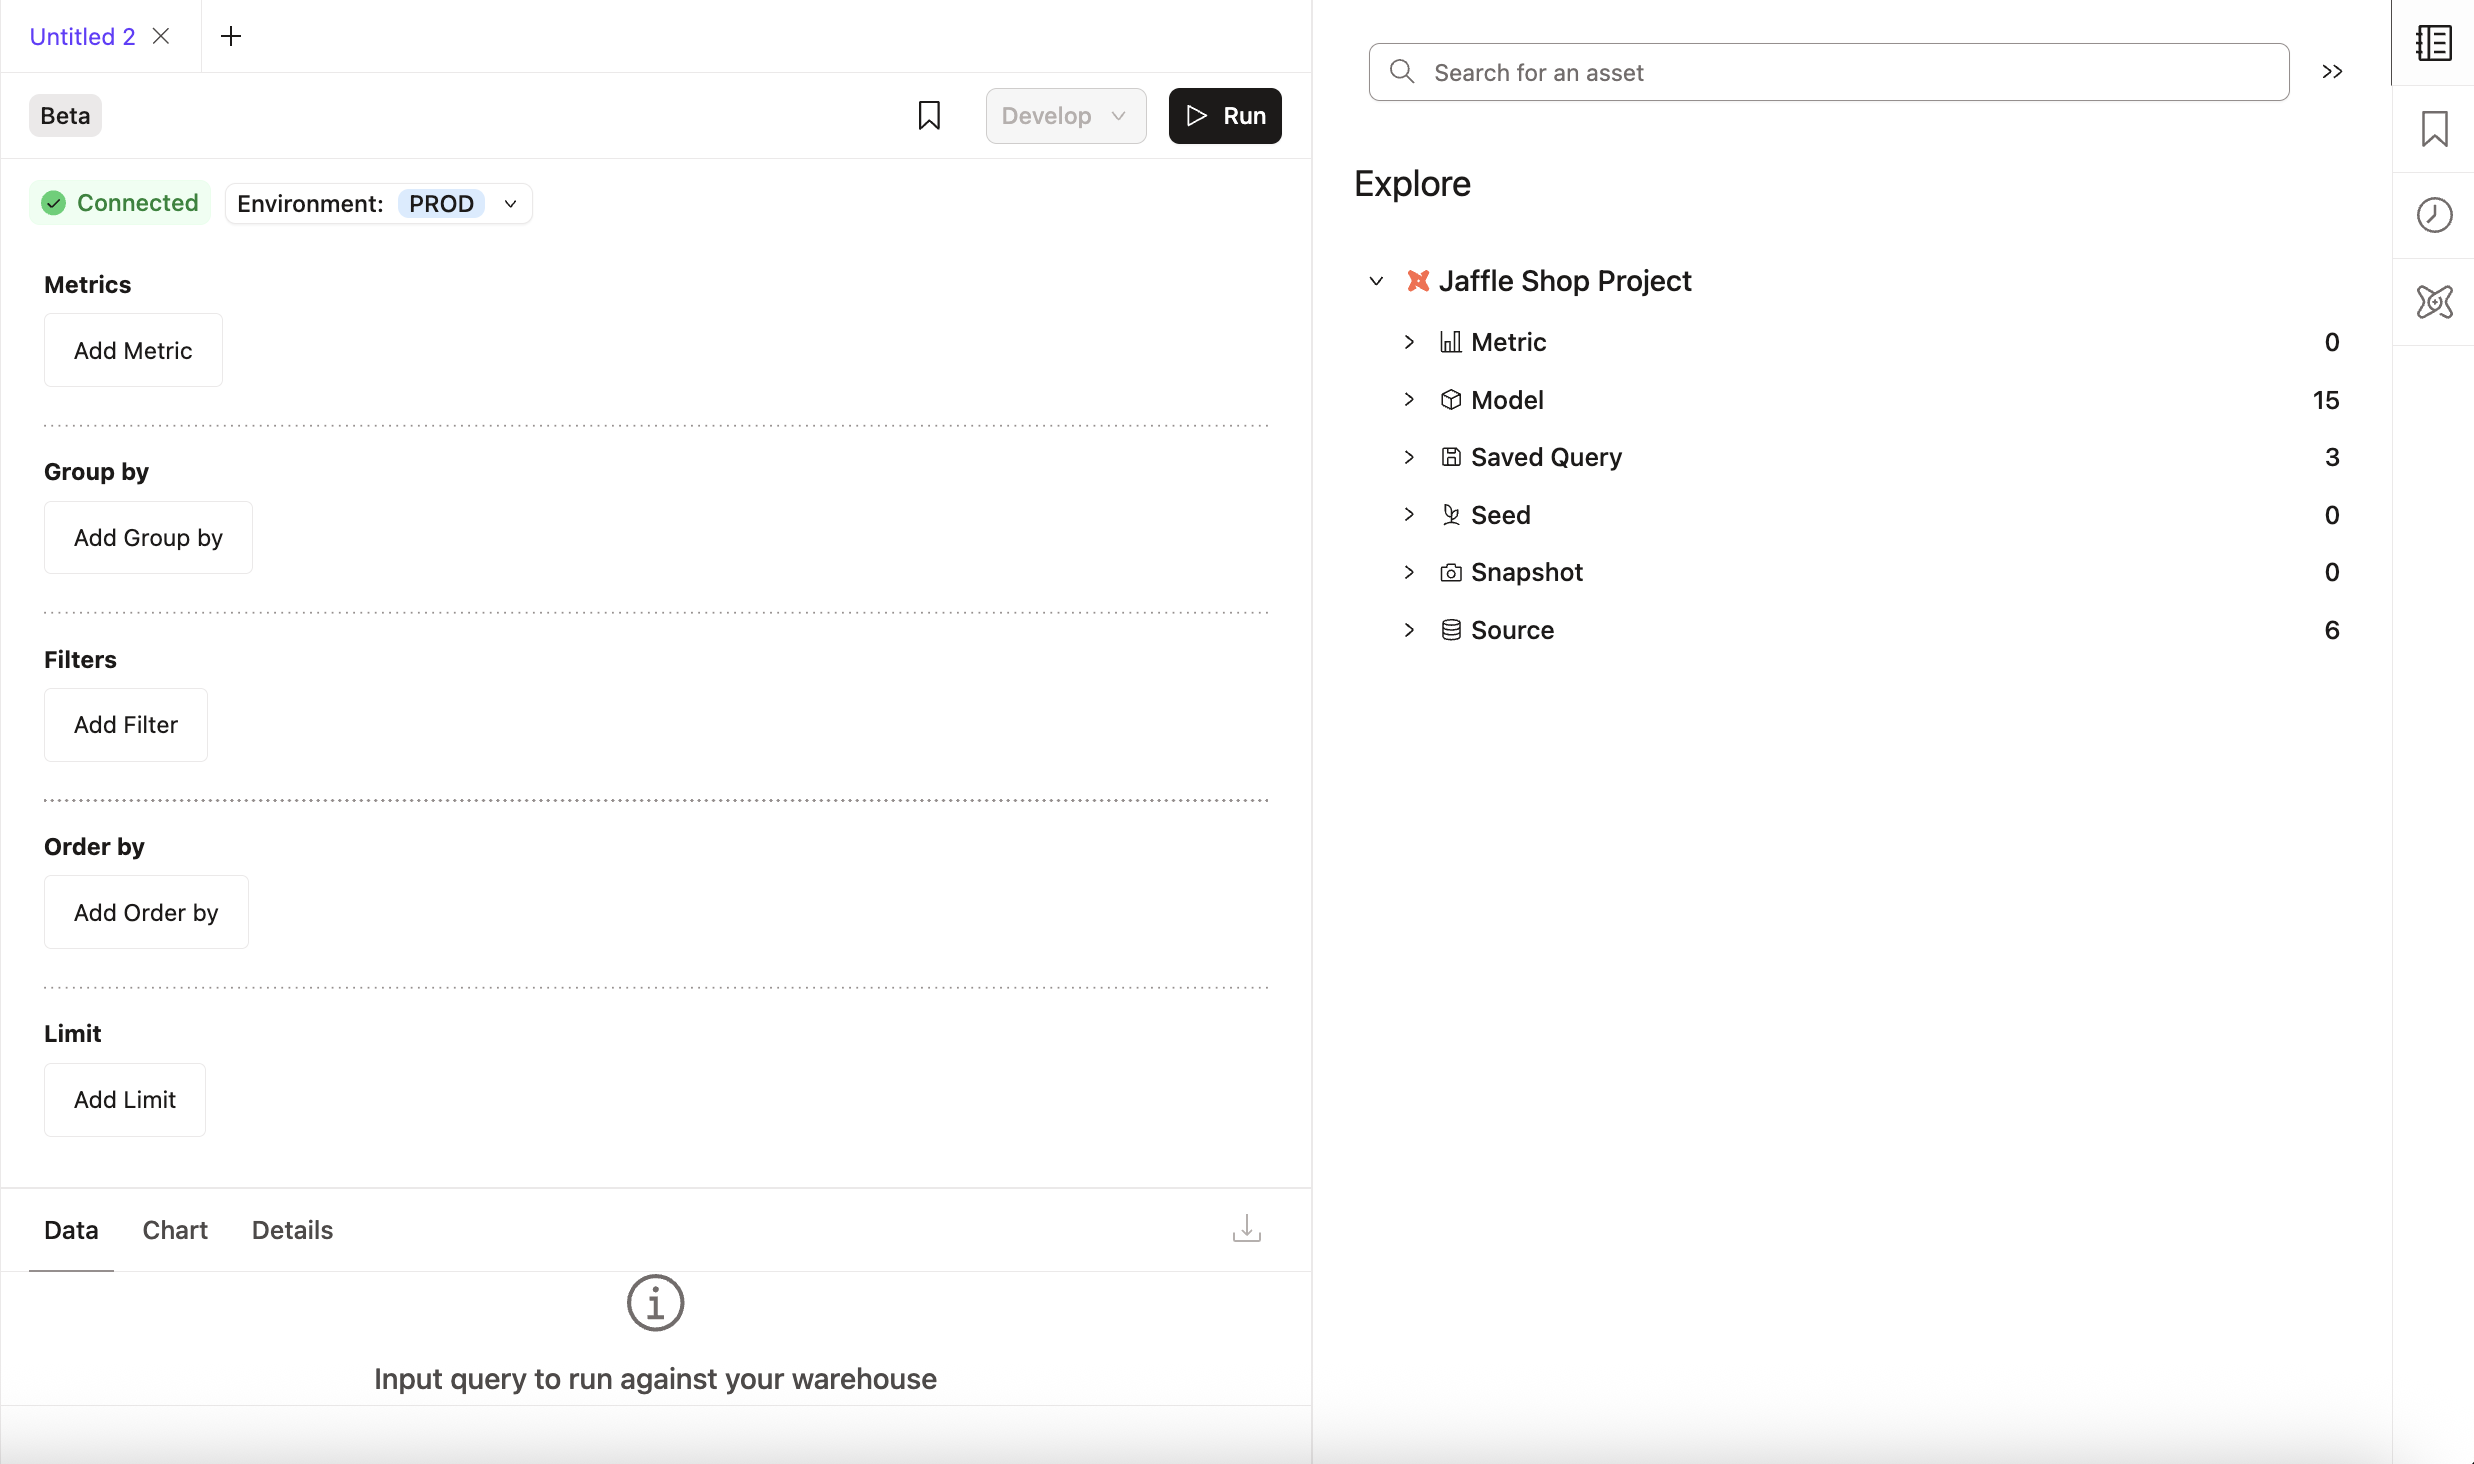
Query Builder in dbt Insights lets you build queries against the Semantic Layer without writing SQL code. It guides you in creating queries based on available metrics, dimensions, and entities. With Query Builder, you can:
- Build analyses from your predefined semantic layer metrics.
- Have filters, time ranges, and aggregates tailored to the semantic model.
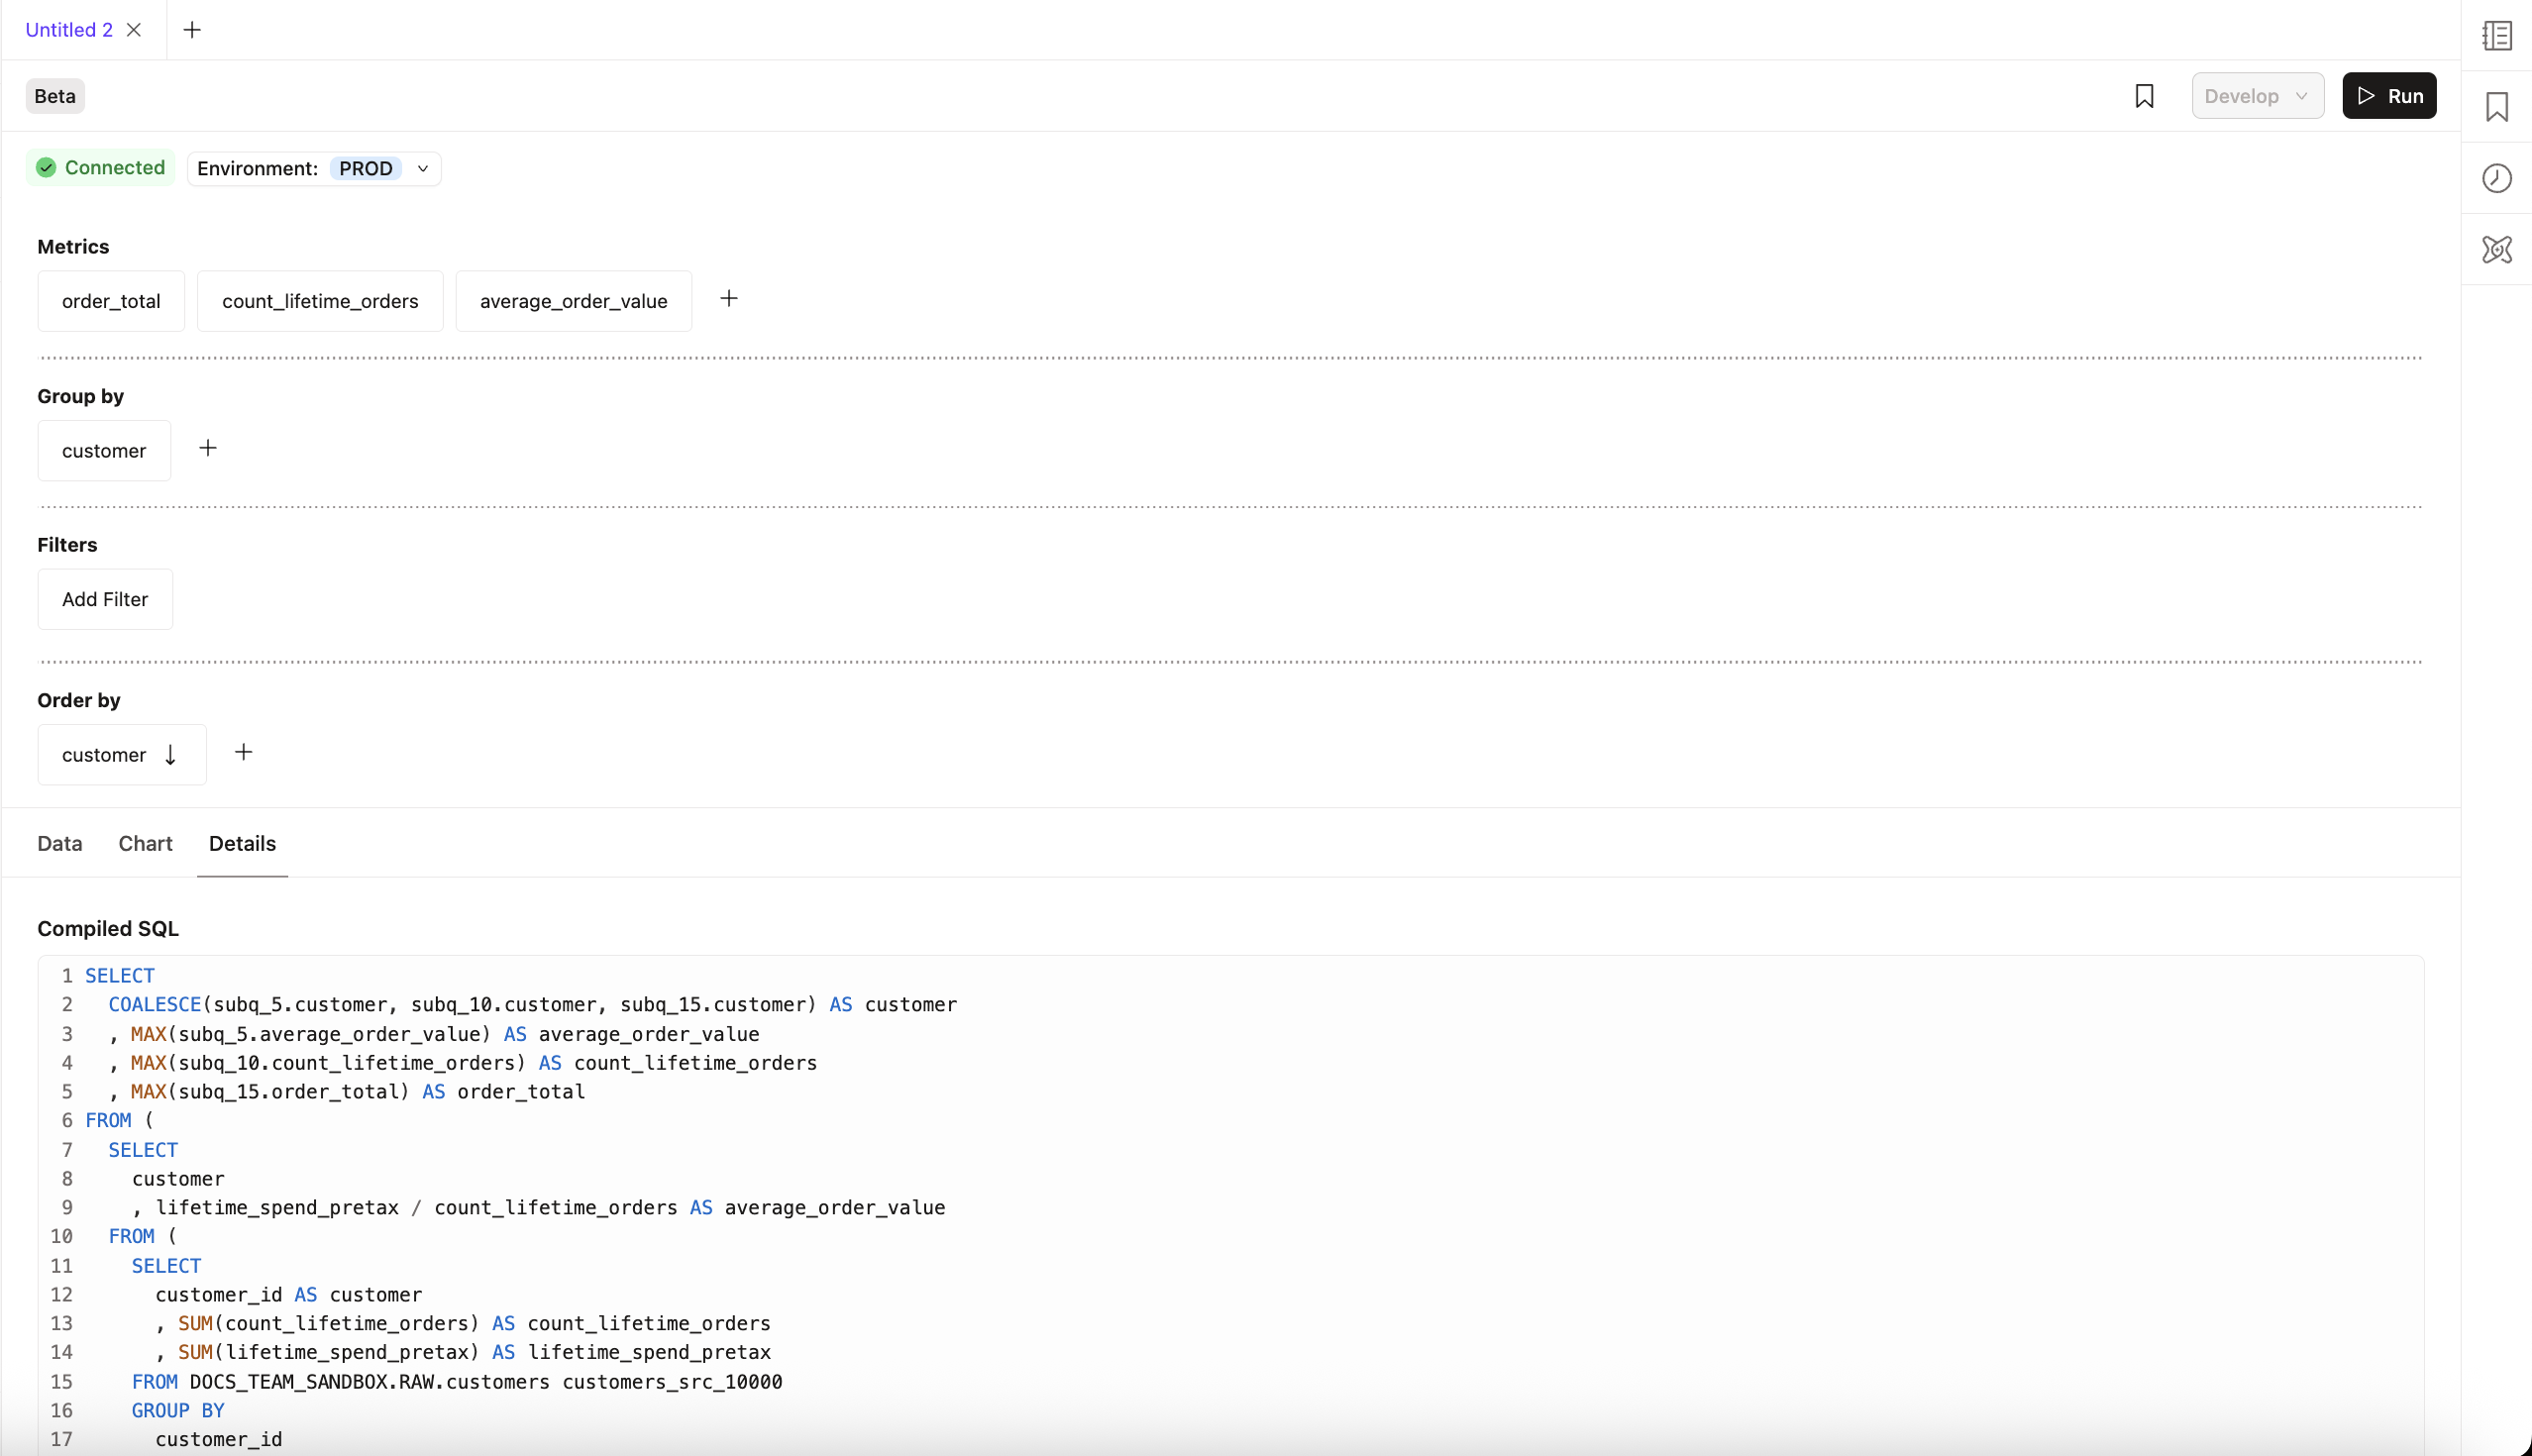
- View the underlying SQL code for each metric query.
To create a query in Query Builder:
-
From the main menu, go to Insights.
-
Click Build a query.
-
Select what you want to include in your query.
- Click Add Metric to select the metrics for your query.
- Click Add Group by to choose the dimensions that break down your metric, such as time grain (day, week, month), region, product, or customer.
- Click Add Filter to create a filter to narrow your results.
- Click Add Order by to select how you want to sort the results of your query.
- Click Add Limit, select the amount of results you want to see when you run your query. If left blank, you will get all the results.
-
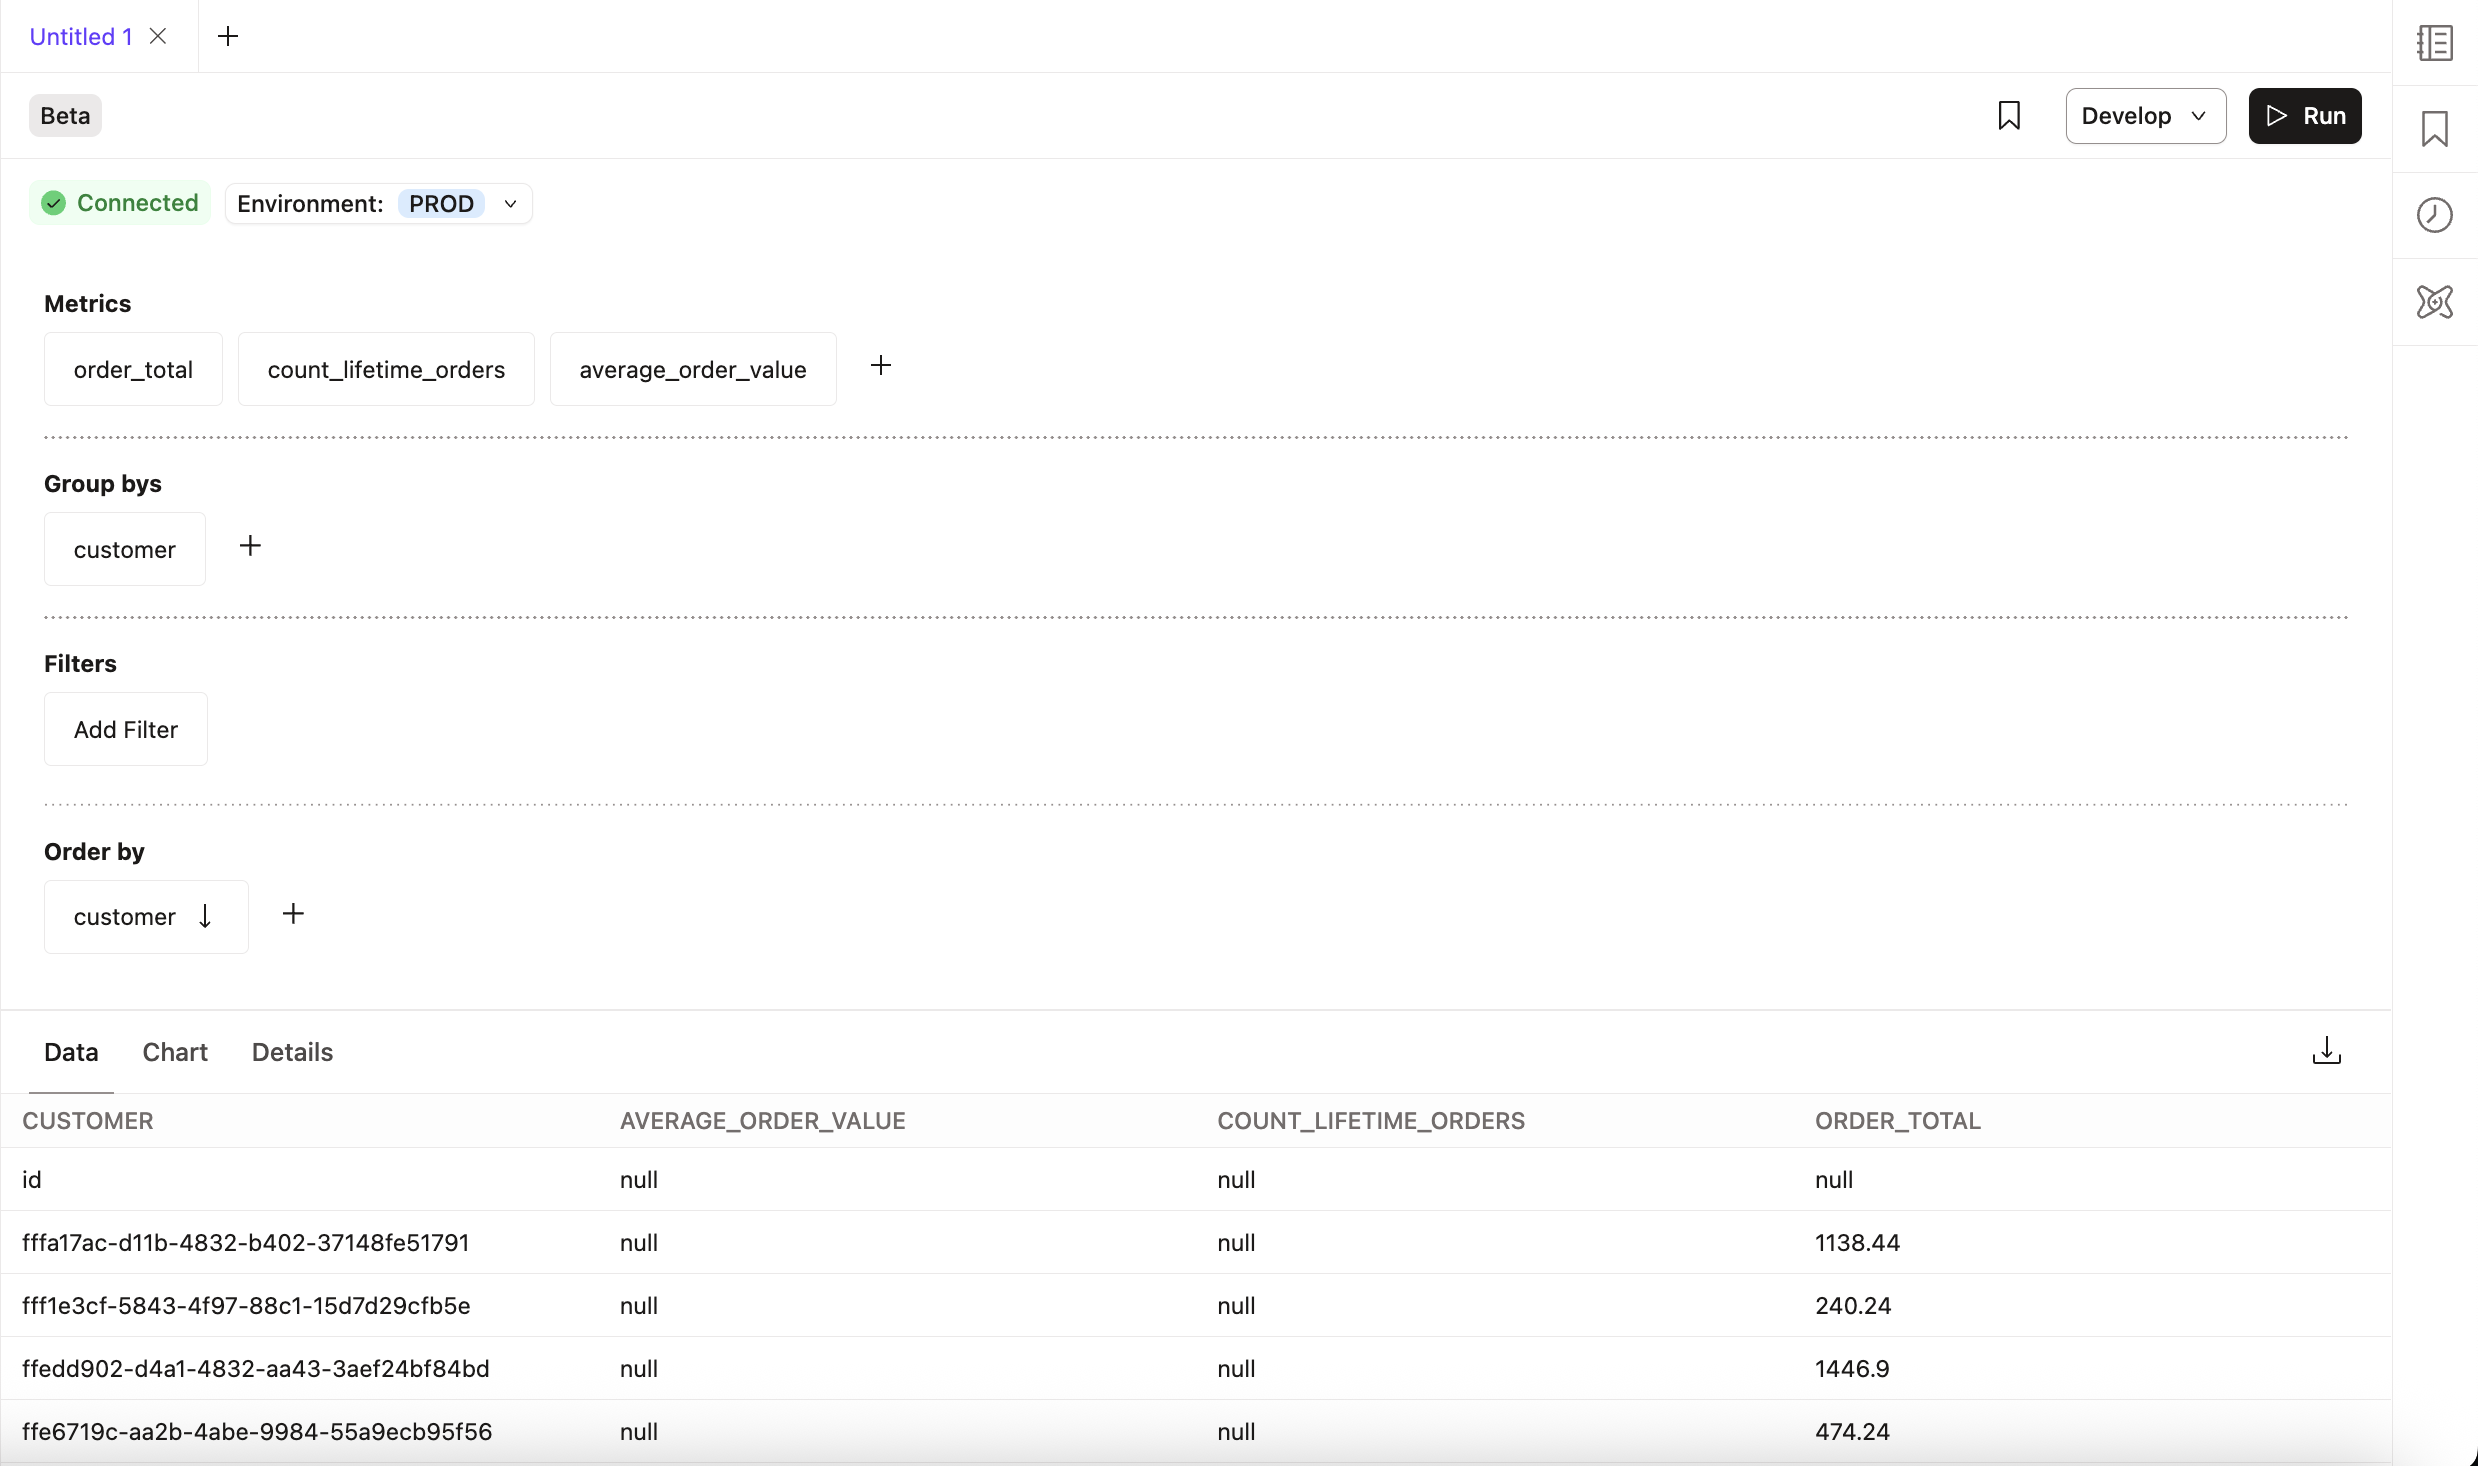
Click Run to run your query. Results are available in the Data tab. You can see the SQL code generated in the Details tab.
Query output panel
The Query output panel is below the query editor and displays the results of a query. It displays the following tabs to analyze query execution and visualize results:
- Data tab — Preview your SQL results, with results paginated.
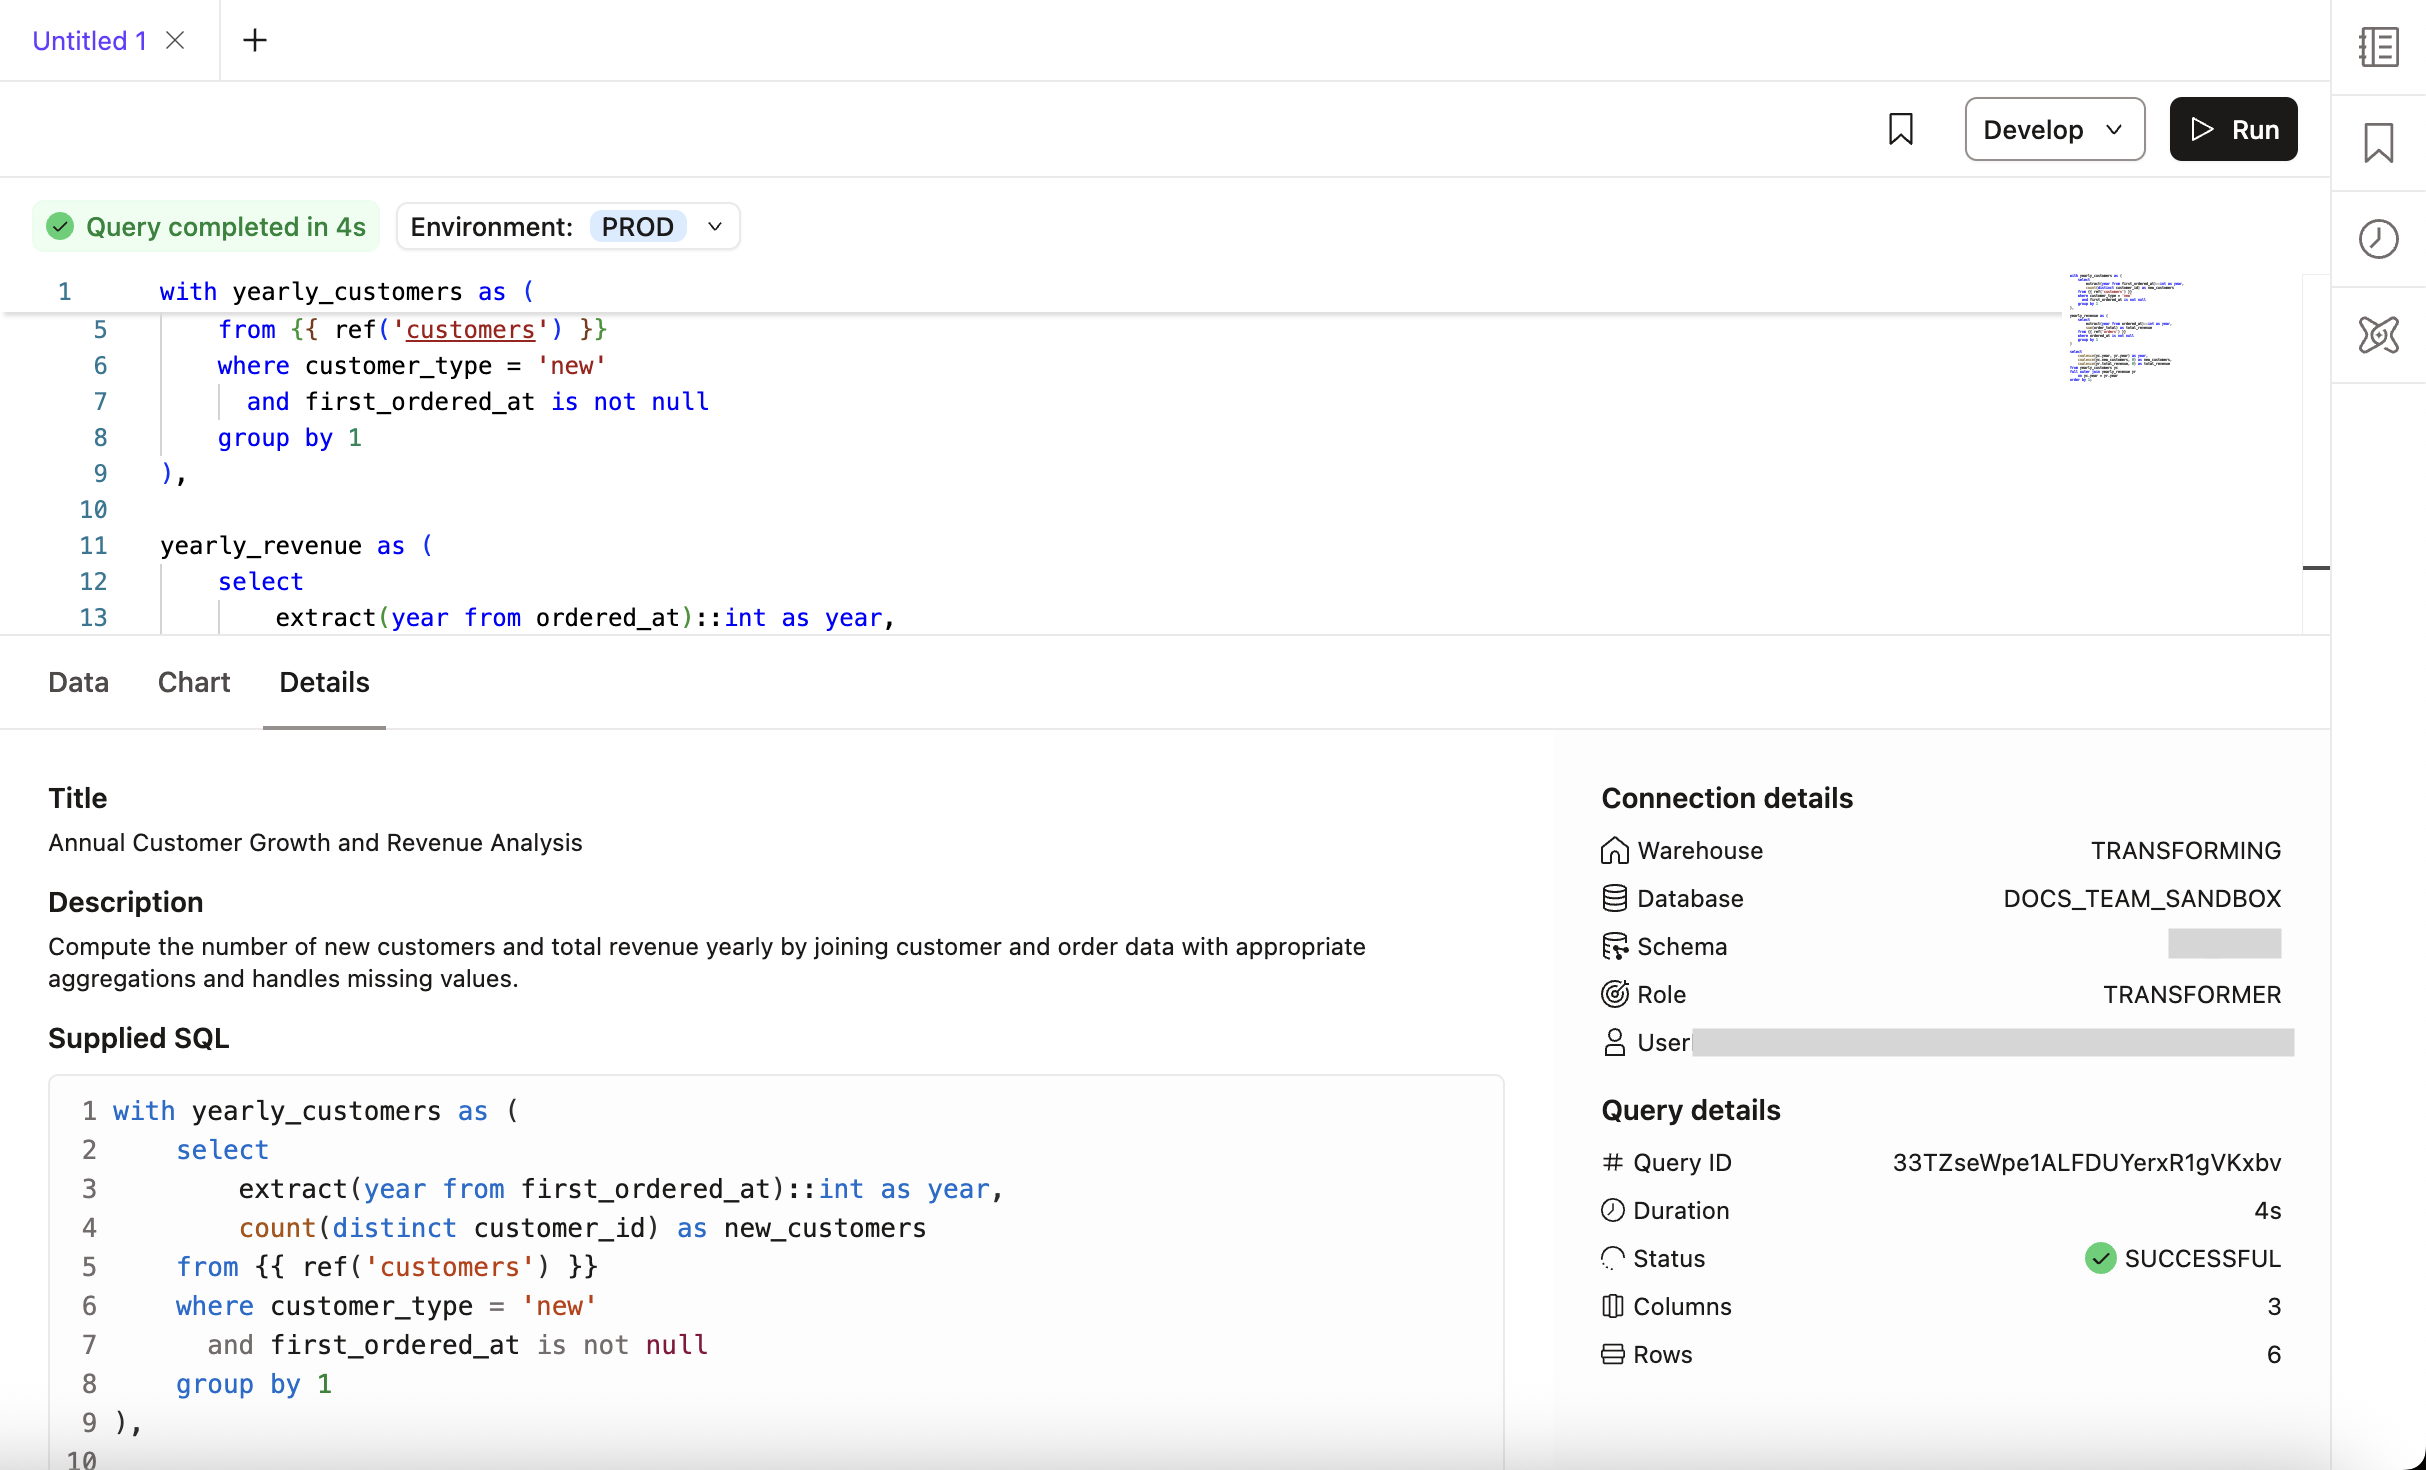
- Details tab — Generates succinct details of executed SQL query:
- Query metadata — Copilot's AI-generated title and description. Along with the supplied SQL and compiled SQL.
- Connection details — Relevant data platform connection information.
- Query details — Query duration, status, column count, row count.
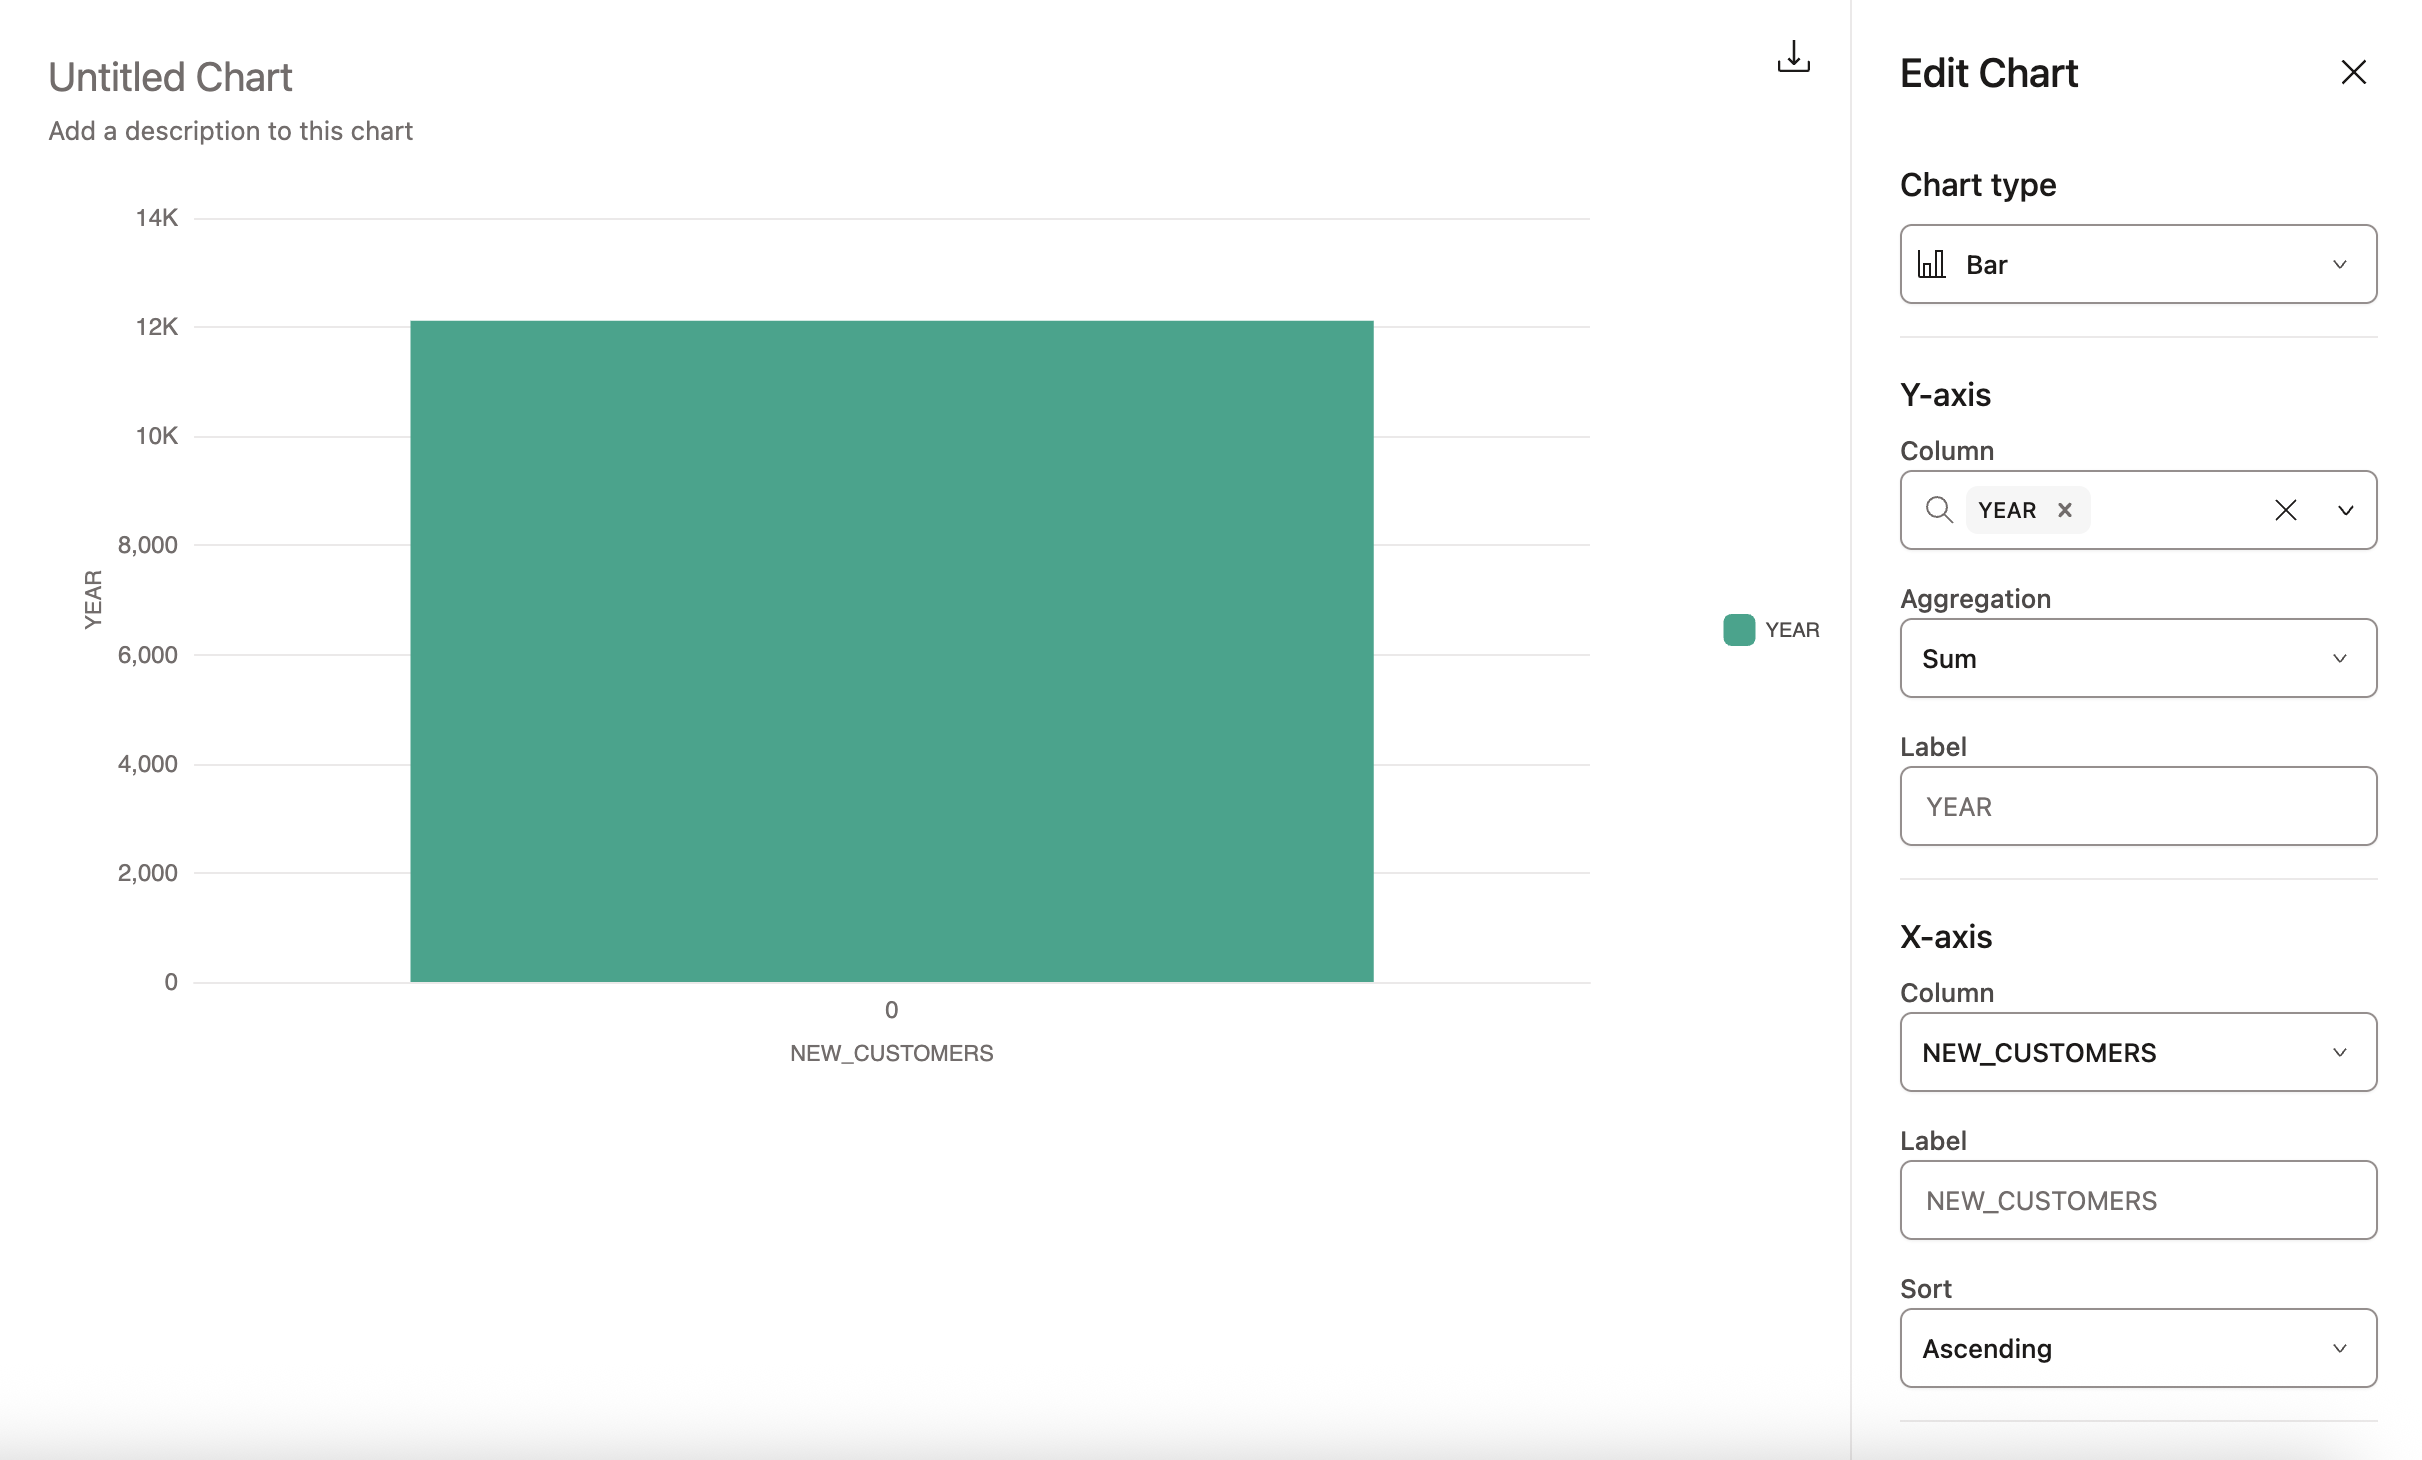
- Chart tab — Visualizes query results with built-in charts.
- Use the chart icon to select the type of chart you want to visualize your results. Available chart types are line chart, bar chart, or scatterplot.
- Use the Chart settings to customize the chart type and the columns you want to visualize.
- Available chart types are line chart, bar chart, or scatterplot.
- Download button — Allows you to export the results to CSV
Query console sidebar menu
The Query console sidebar menu and icons contains the following options:
dbt Catalog
Catalog icon — View your project's models, columns, metrics, and more using the integrated Catalog view.
Bookmark
Save and access your frequently used queries.
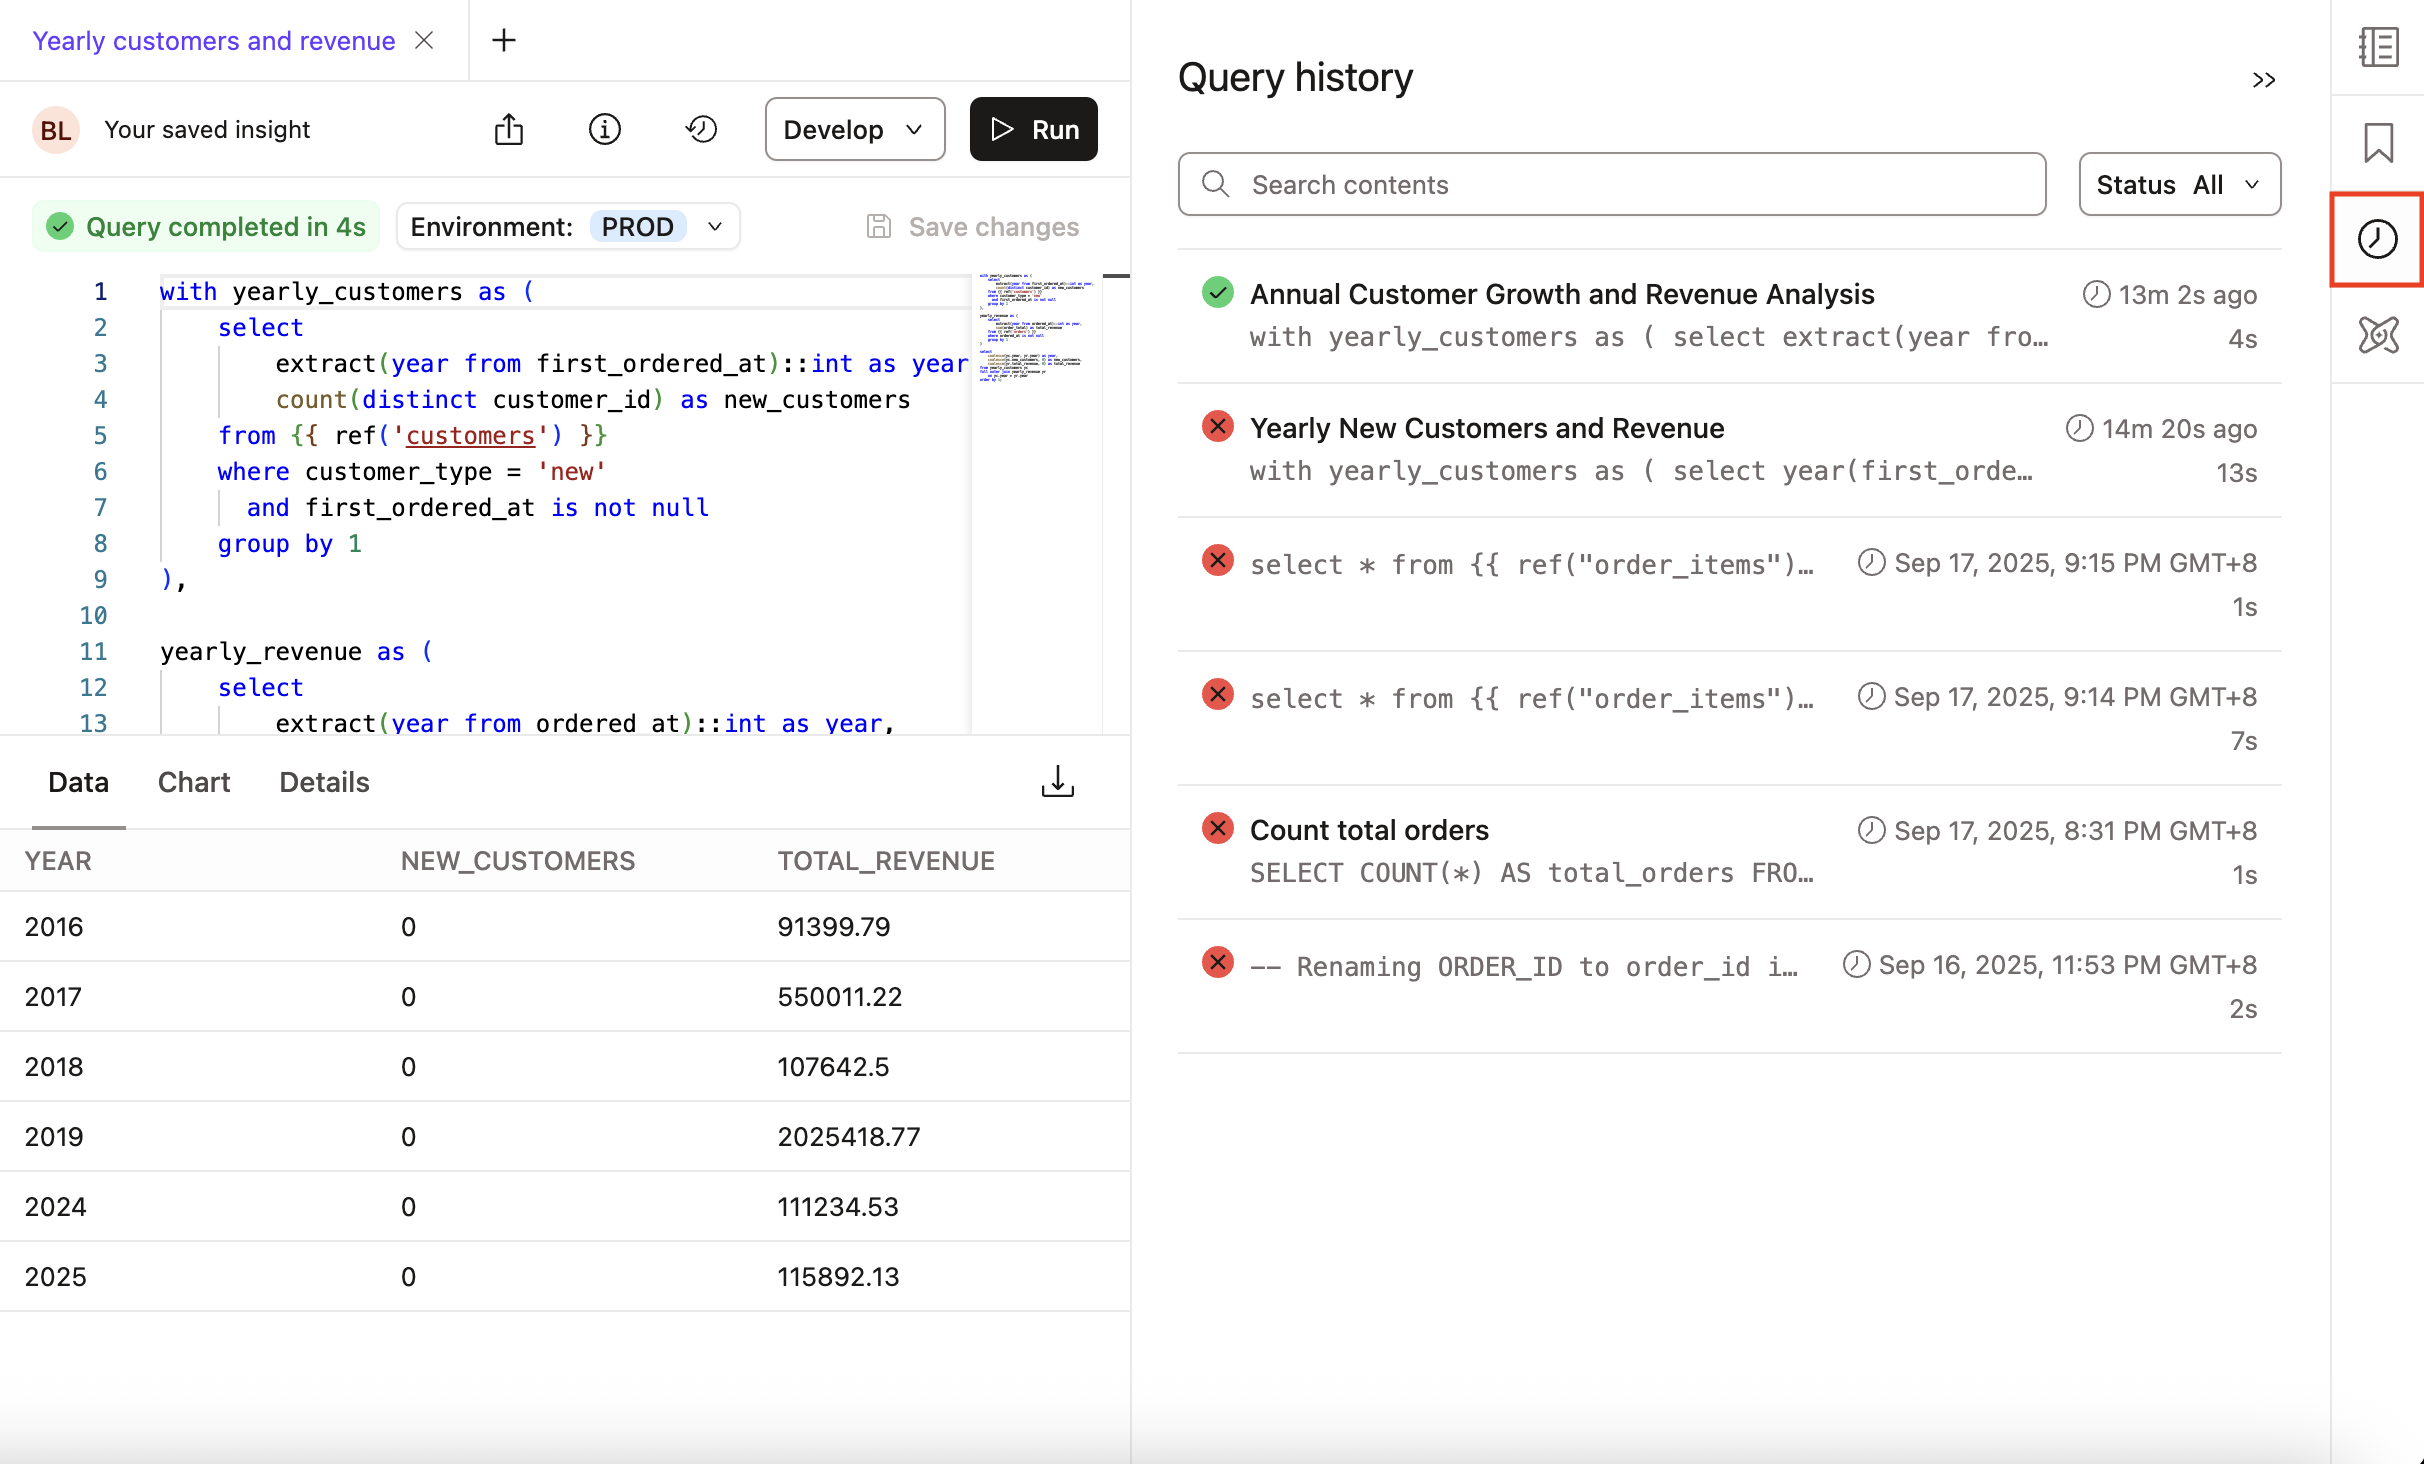
Query history
View past queries, their statuses (All, Success, Error, or Pending), start time, and duration. Search for past queries and filter by status. You can also re-run a query from the Query history.
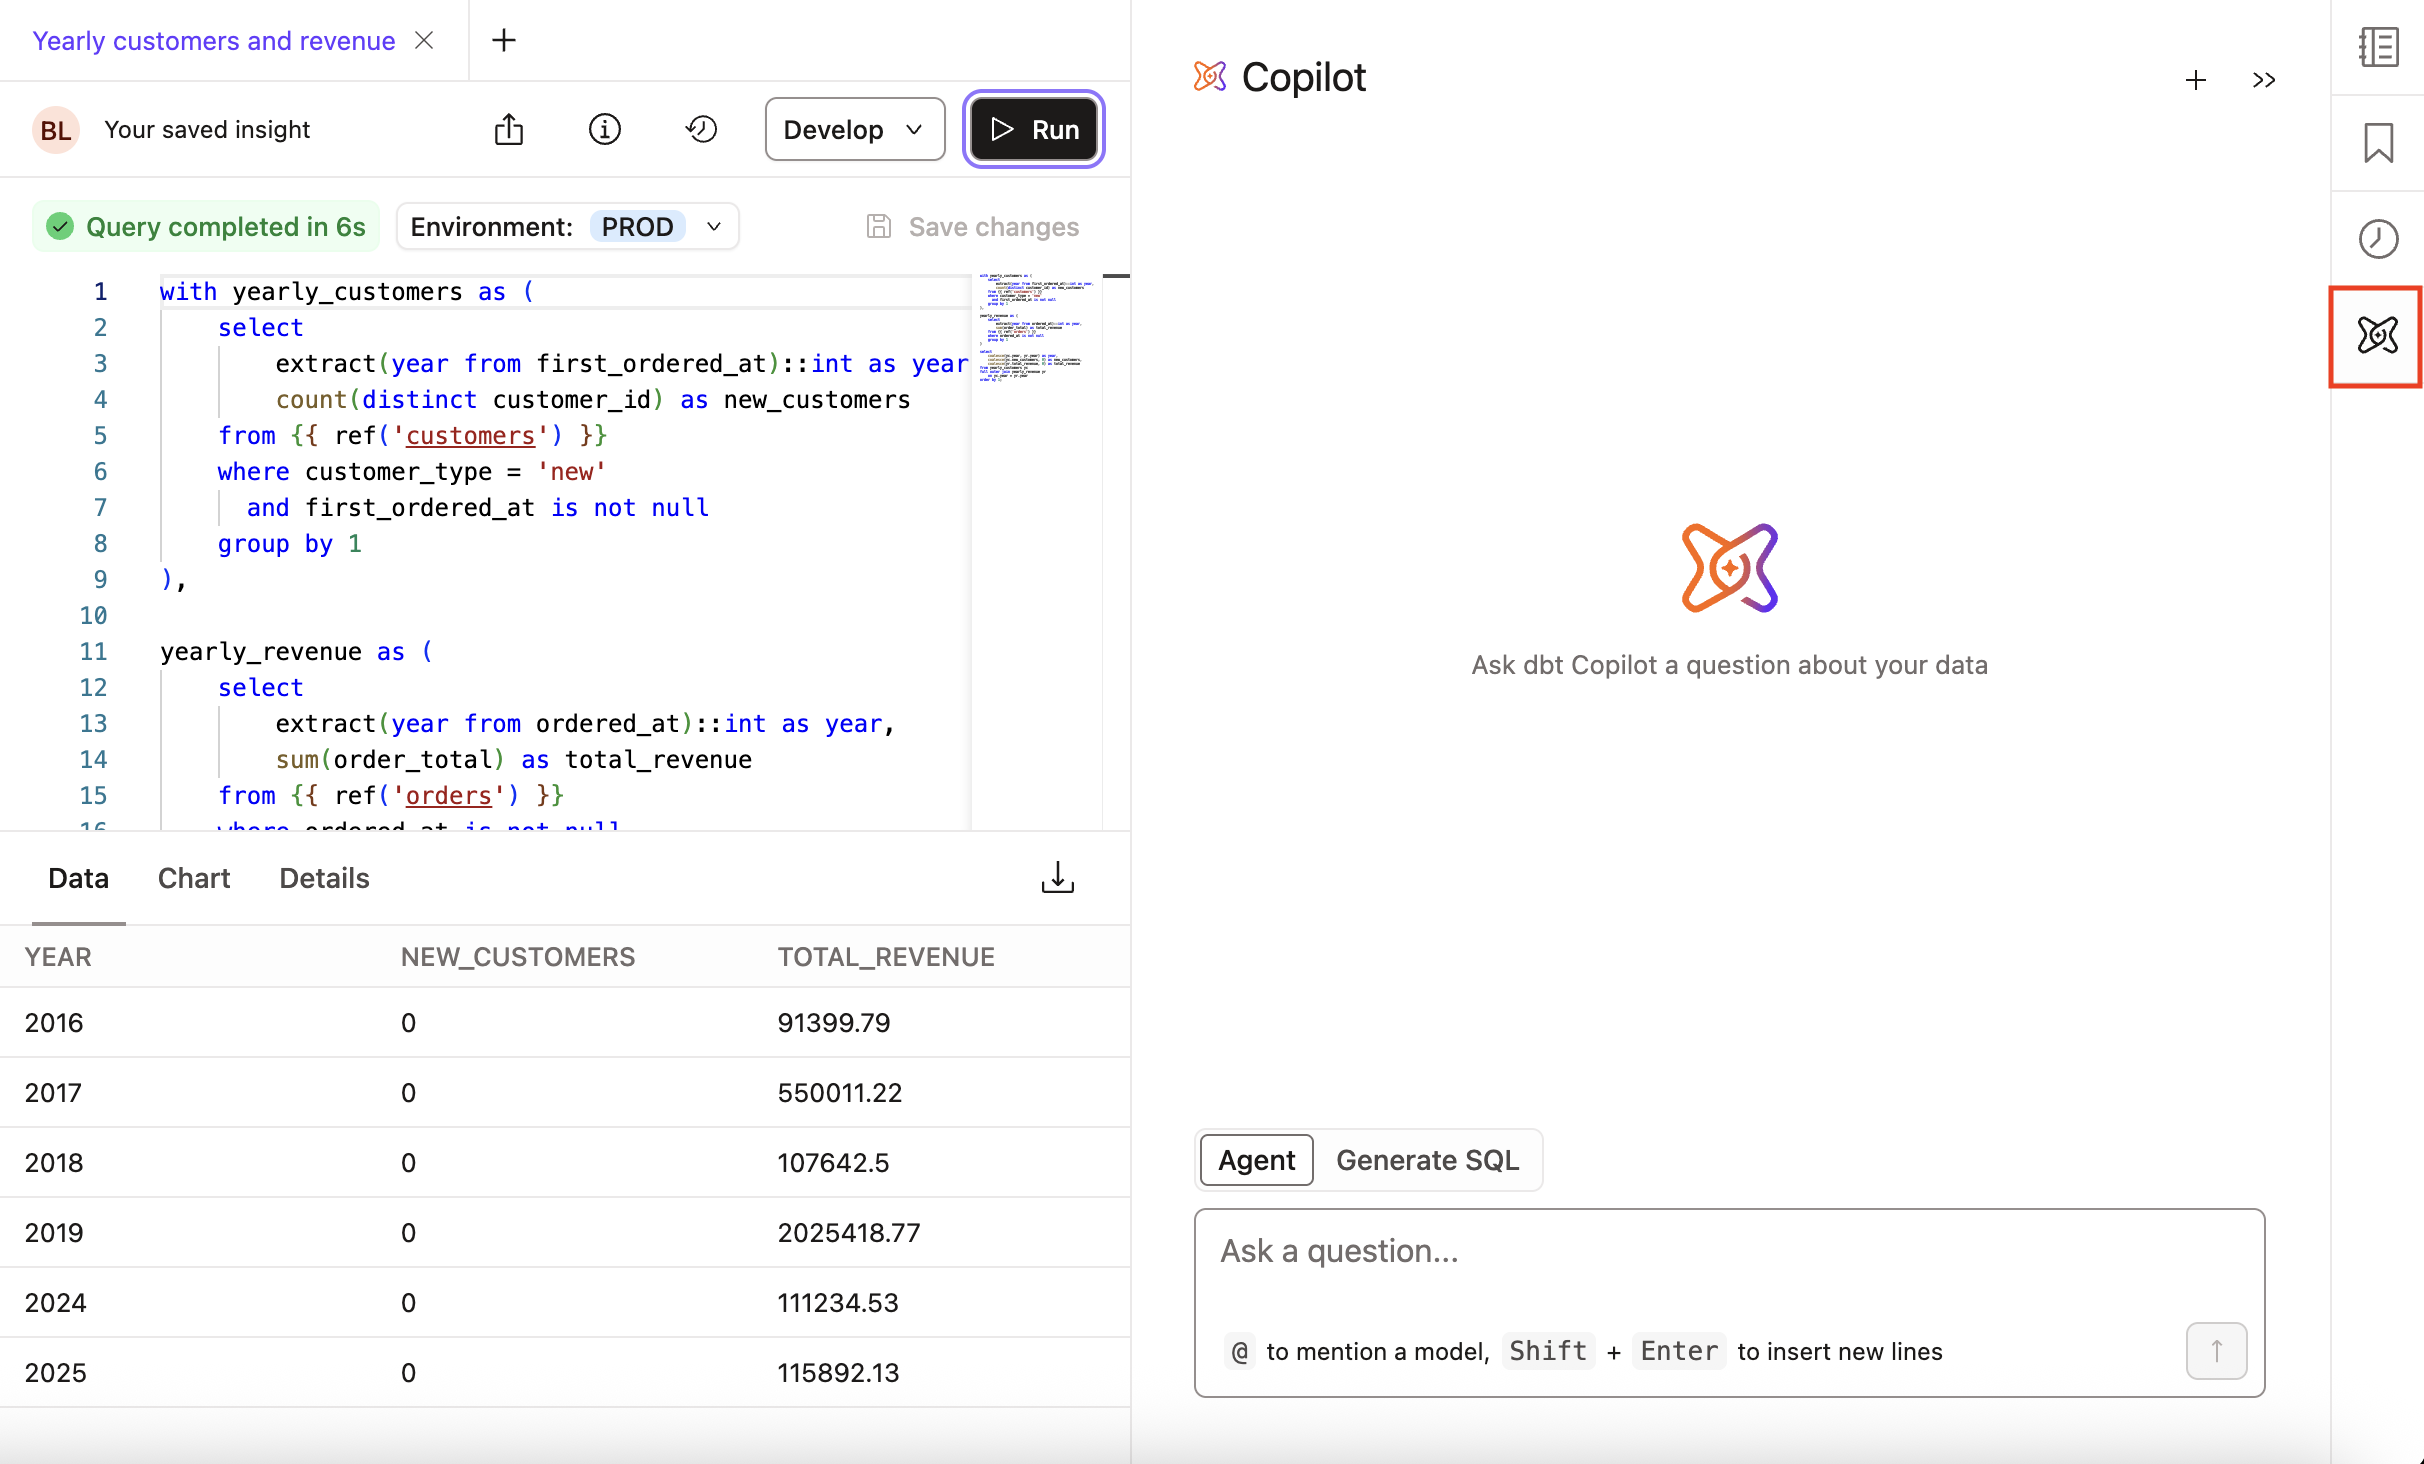
dbt Copilot
Use dbt Copilot's AI assistant to modify or generate queries using natural language prompts or to chat with the Analyst agent to gather insights about your data. There are two ways you can use dbt Copilot in Insights to interact with your data:
-
Agent tabPrivate beta - Ask questions to the Analyst agent to get intelligent data analysis with automated workflows, governed insights, and actionable recommendations. This is a conversational AI feature where you can ask natural language prompts and receive analysis in real-time. To request access to the Analyst agent, join the waitlist.
Some sample questions you can ask the agent:
- What region are my sales growing the fastest?
- What was the revenue last month?
- How should I optimize my marketing spend next quarter?
- How many customers do I have, broken down by customer type?
The Analyst agent creates an analysis plan based on your question. The agent:
- Gets context using your semantic models and metrics.
- Generates SQL queries using your project's definitions.
- Executes the SQL query and returns results with context.
- Reviews and summarizes the generated insights and provides a comprehensive answer.
The agent can loop through these steps multiple times if it hasn't reached a complete answer, allowing for complex, multi-step analysis.
For more information, see Analyze data with the Analyst agent.
-
Generate SQL tab - Build queries in Insights with natural language prompts to explore and query data with an intuitive, context-rich interface. For more information, see Build queries.
LSP features
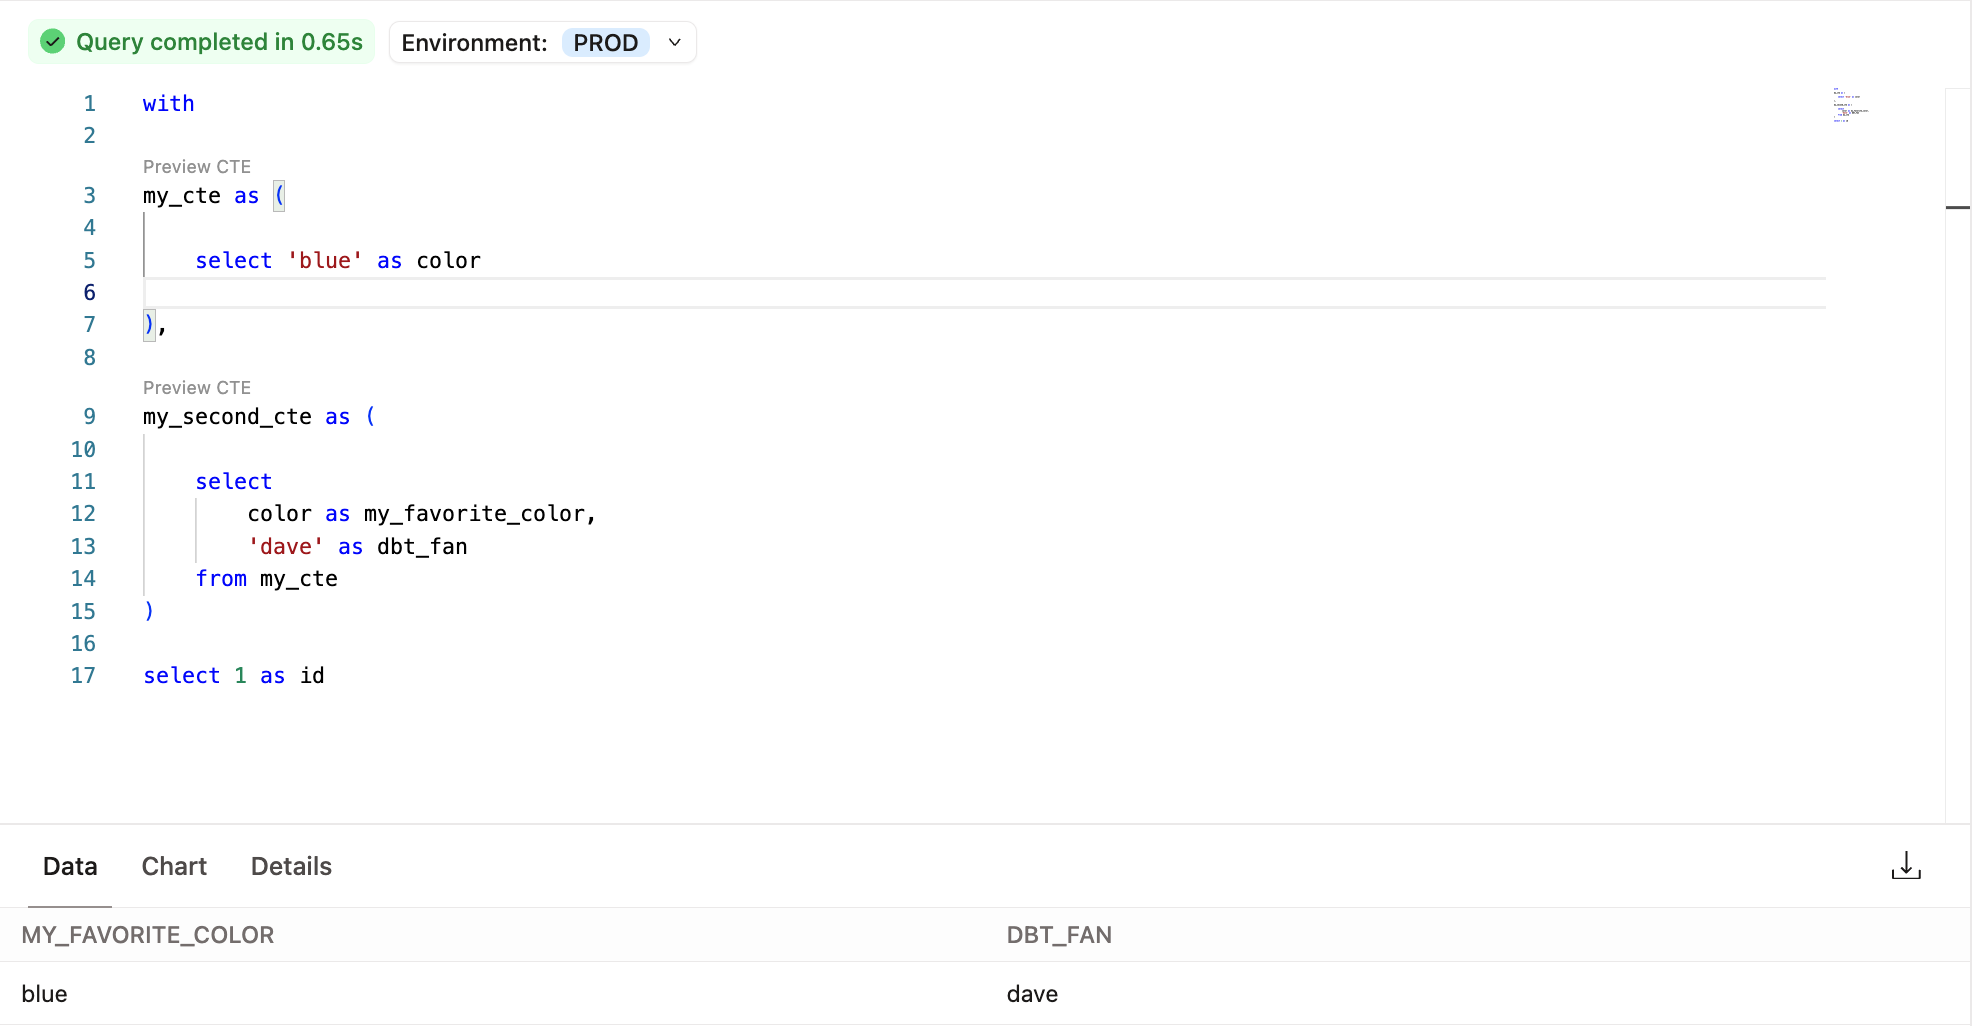
The following Language Server Protocol (LSP) features are available for projects upgraded to Fusion:
-
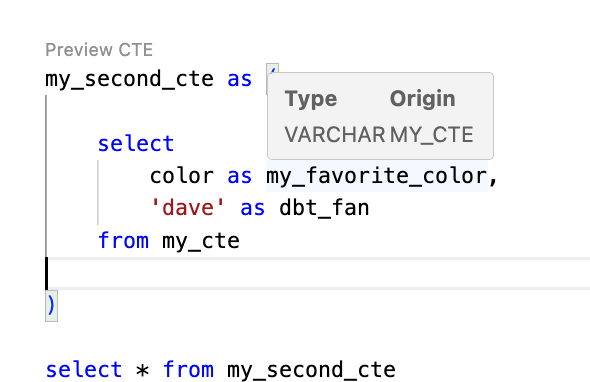
Live CTE previews: Preview a CTE’s output for faster validation and debugging.
-
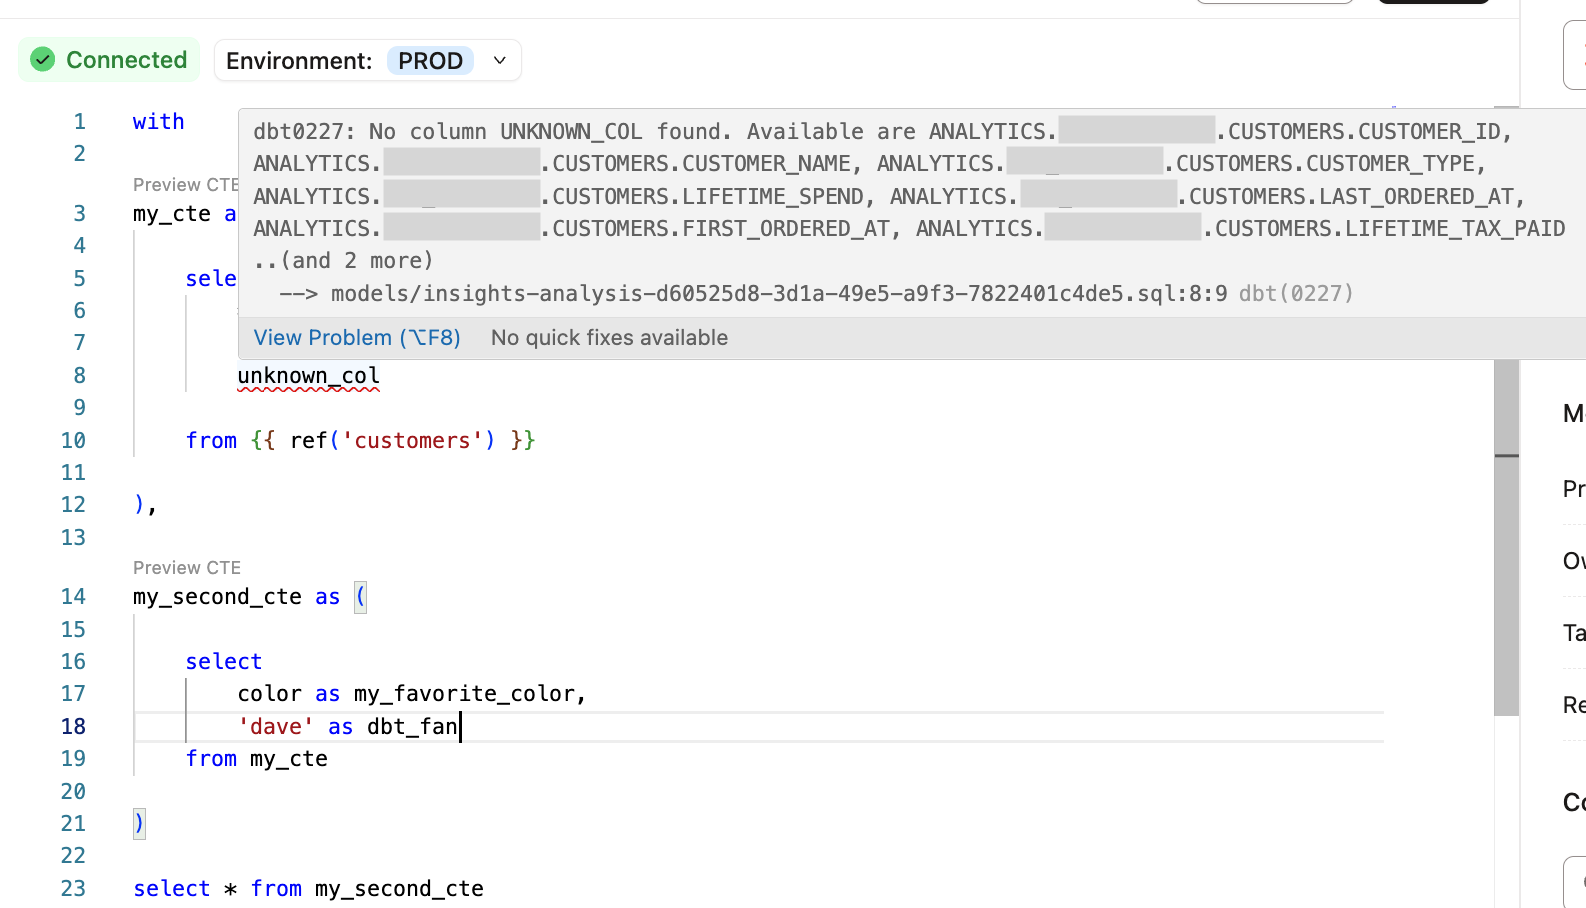
Real-time error detection: Automatically validate your SQL code to detect errors and surface warnings, without hitting the warehouse. This includes both dbt errors (like invalid
ref) and SQL errors (like invalid column name or SQL syntax). -
refsuggestions: Autocomplete model names when using theref()function to reference other models in your project. -
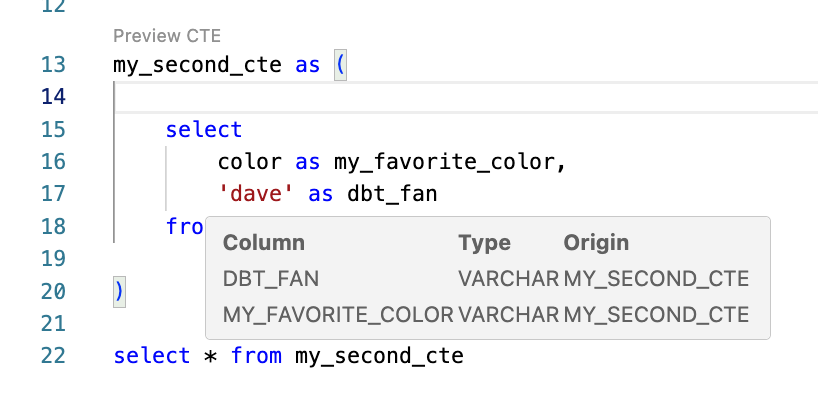
Hover insights: View context on tables, columns, and functions without leaving your code. Hover over any SQL element to see details like column names and data types.
Was this page helpful?
This site is protected by reCAPTCHA and the Google Privacy Policy and Terms of Service apply.
